
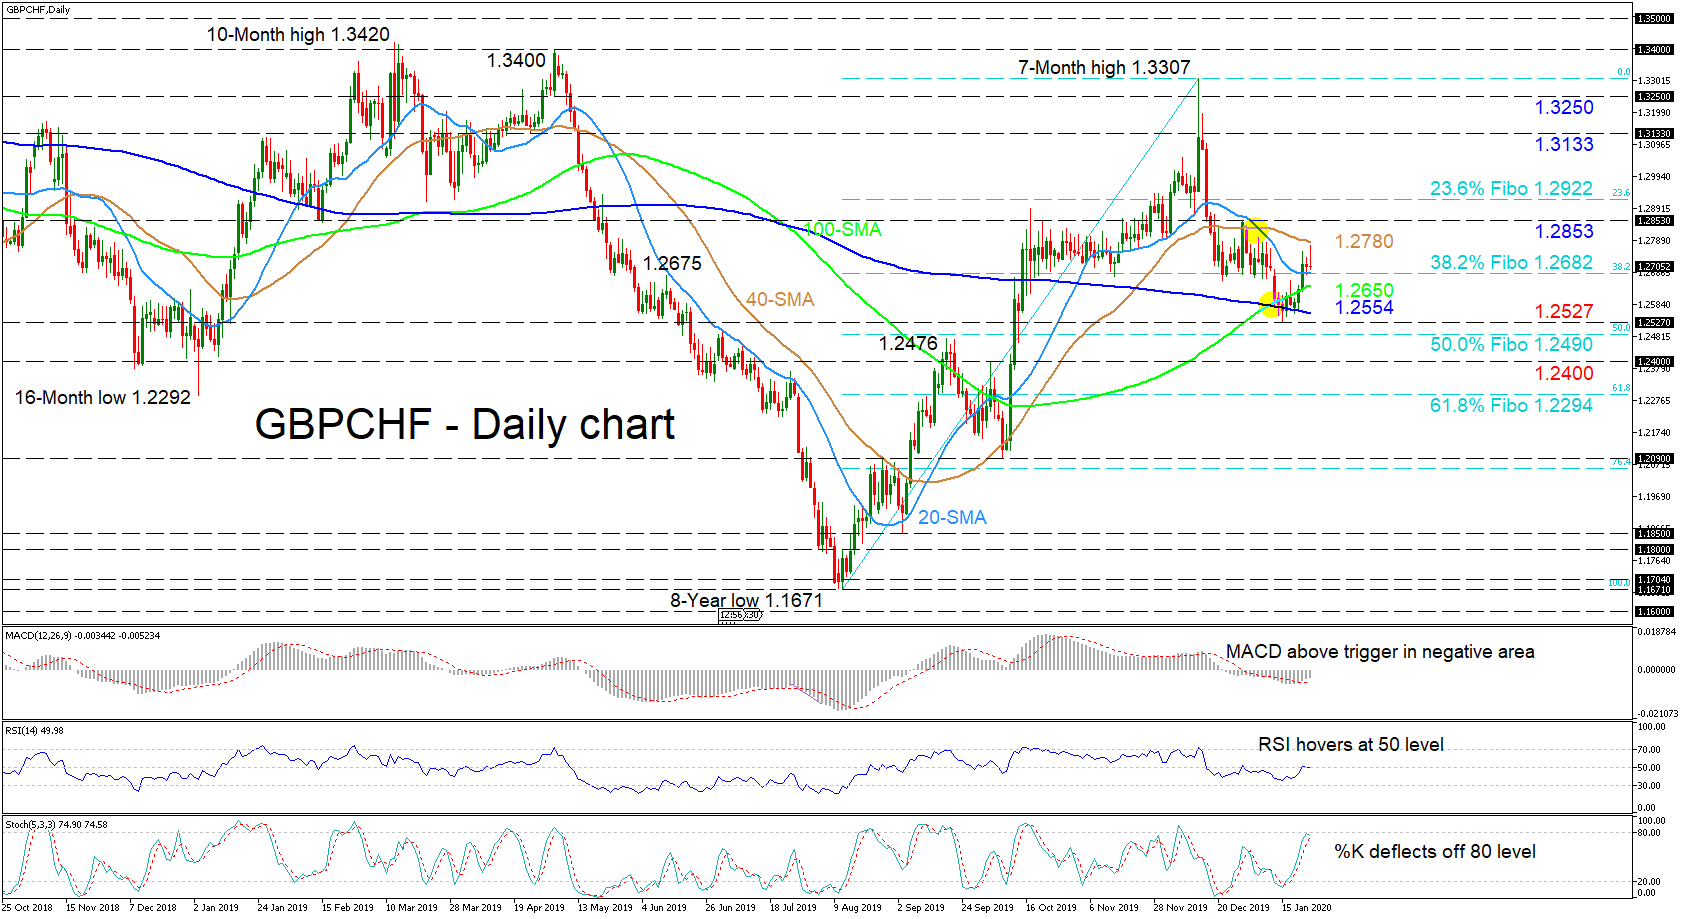
GBPCHF’s correction from the seven-month high of 1.3307 bounced off the 200-day simple moving average (SMA) and is now confined between the downward sloping 50-day SMA and the flat 20-day one, located at 1.2682, which is the 38.2% Fibonacci retracement of the up leg from 1.1671 to 1.3307.
The short-term oscillators are reflecting mixed signals in momentum. The MACD in the negative zone has moved above its red trigger line, while the Stochastics %K line has deflected off the 80 overbought level. However, with the RSI currently hovering at its neutral mark and the trajectory of the 20-, 50- and 100-day SMAs, it appears that the price may consolidate for a while.
Steering lower, sellers would initially encounter upside pressure from the 38.2% Fibo of 1.2682 – joined with the 20-day SMA – and the 100-day SMA at 1.2650 underneath. Clearing below this section, the bears efforts to drop lower could be prevented by the region from the 200-day SMA at 1.2554 to the 50.0% Fibo of 1.2490, which also encompasses the latest swing low of 1.2527. Diving lower, the 1.2400 support could attract attention ahead of the 61.8% Fibo of 1.2294.
To the upside, immediate resistance comes at the 50-day SMA at 1.2780, before the swing high of 1.2853 from December 31 and the 23.6% Fibo of 1.2922 overhead. Conquering the latter, could rally the pair to test the 1.3133 and 1.3250 inside swing lows from April and May of last year.
Overall, the short-term bias is neutral and a break below 1.2527 or above 1.2853 would increase the odds for the next direction. However, a break below 1.2476 would throw into question the medium-term positive outlook.


