
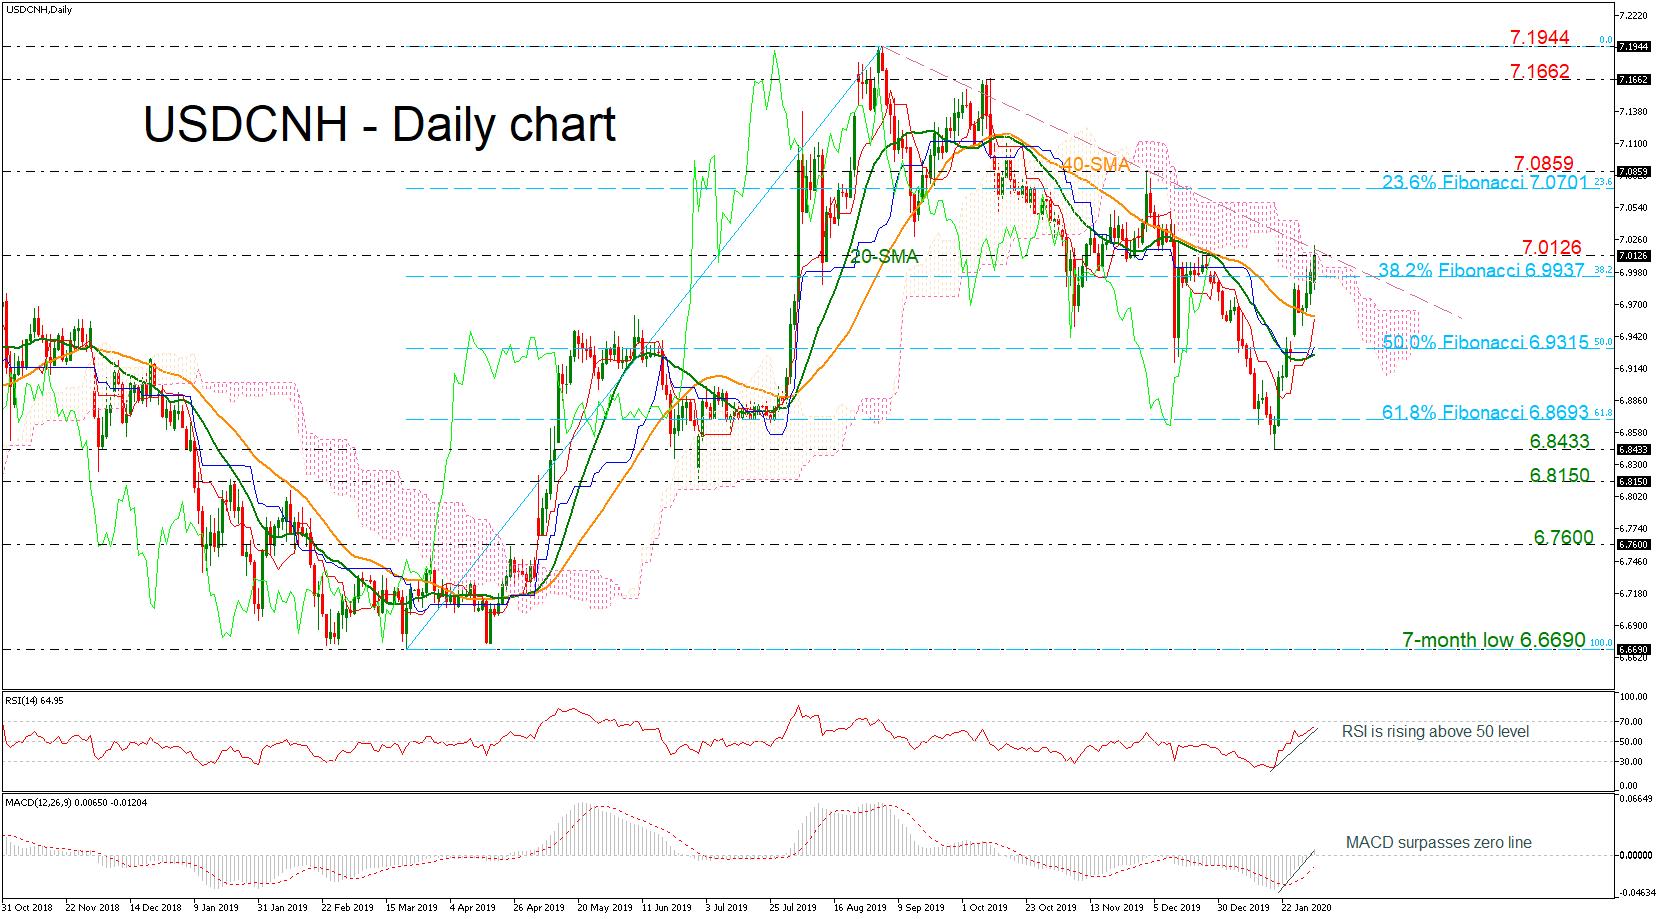
USDCNH seems to be stronger over the last three trading days, challenging the five-month descending trendline and the upper band of the Ichimoku cloud, near the 7.0126 resistance level.
The technical indicators are feeding prospects for a possible positive short-term move above the falling trendline, as the RSI holds well above 50 and is pointing up, while the MACD continues to strengthen in the bullish territory and above its red trigger line. Also, in Ichimoku indicators, the red Tenkan-sen line keeps rising above the blue Kijun-sen line.
If 7.0126 proves easy to get through, the spotlight could turn to the 7.0701-7.0859 area, the former being the 23.6% Fibonacci retracement level of the upward wave from 6.6690 to 7.1944, switching the downward move to neutral.
A failure to overcome the falling trend line, the yuan could turn down, touching the 38.2% Fibo mark of 6.9937. More losses could drive the price to the 40-day simple moving average (SMA) currently at 6.9592 ahead of the 50.0% Fibo of 6.9315, overlapping with the 20-day SMA and the blue Kijun-sen line.
In the medium-term picture, USDCNH turned negative after pivoting at 7.1944. However, should the market continue the upside run, the outlook may turn brighter.


