
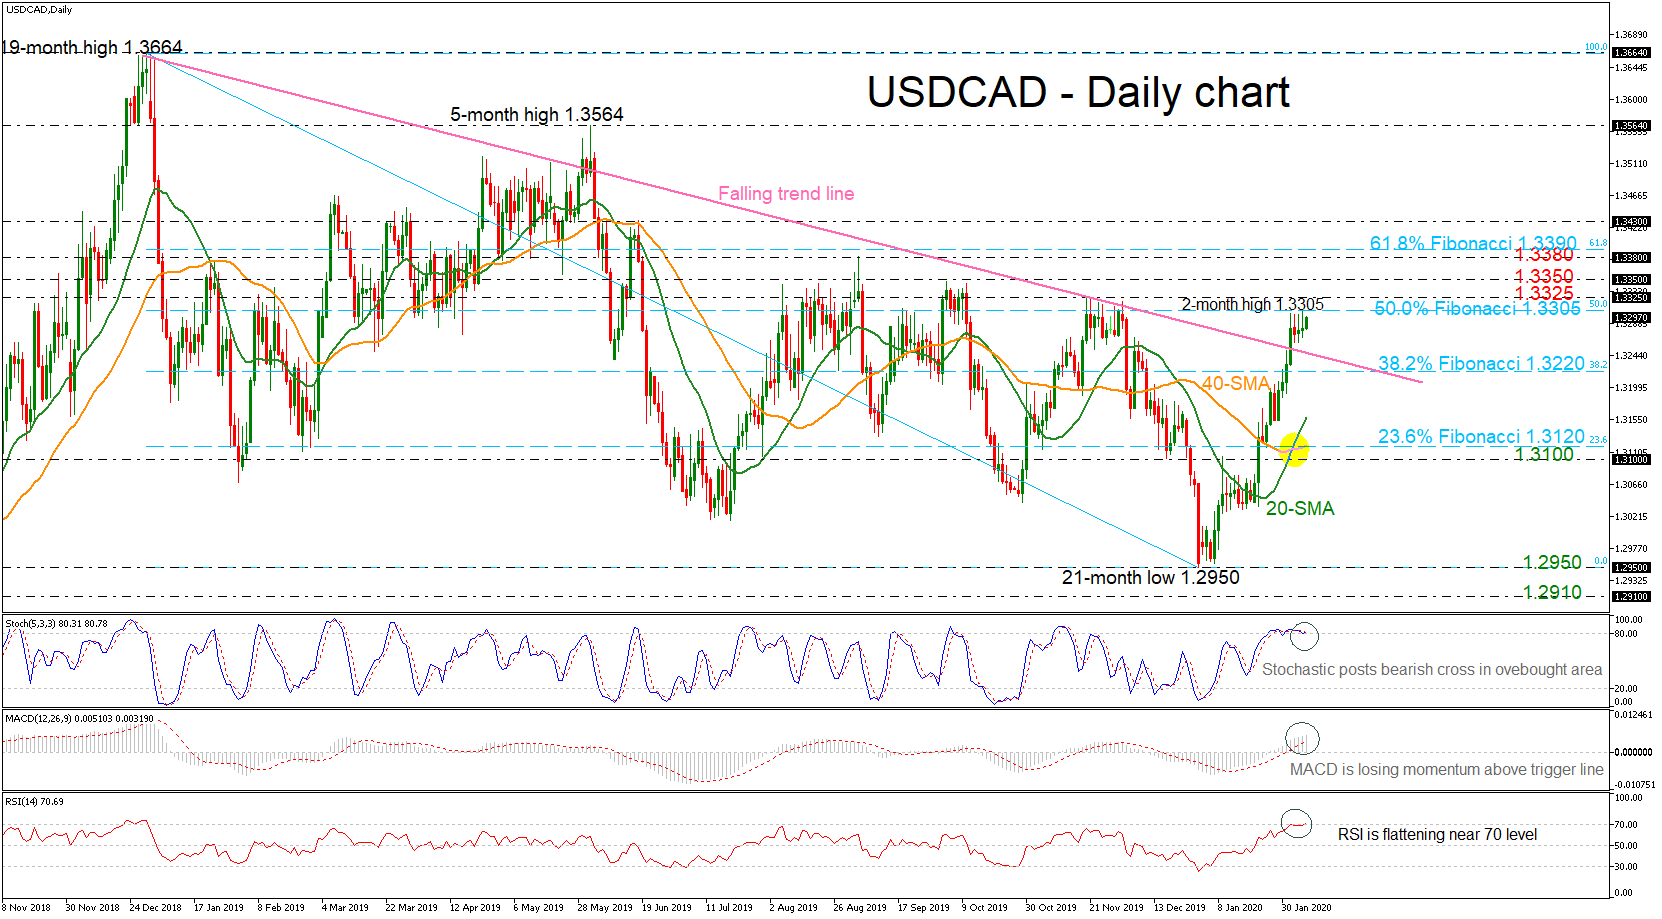
USDCAD recorded a two-month high after successfully jumping over the one-year falling trend line, where the pair encountered a strong barrier at the 50.0% Fibonacci retracement level of the down leg from 1.3664 to 1.2950 at 1.3305.
The buying interest seems to be soft as the technical indicators are suggesting a possible pull back in the short-term. The stochastic oscillator created a bearish crossover within its %K and %D lines in the overbought zone, while the RSI is flattening near its 70 level. Also, the MACD oscillator is weakening its movement above its trigger and zero lines.
However, if the price climbs above the 50.0% Fibo of 1.3305, it would challenge the immediate resistances of 1.3325 and 1.3350, taken from the peaks on November 20 and October 10. The 1.3380 – 1.3390 area, which includes the 61.8% Fibo, which strictly capped by bullish action last year and remains the highlight point.
On the other hand, if the selling pressure come back into play and the market deteriorates below the 38.2% Fibo of 1.3220, it could bring the price towards the 20-day simple moving average (SMA) at 1.3160. Even lower, the door would open for the 23.6% Fibo of 1.3120 – which coincides with the 40-day SMA – and the nearby 1.3100 handle.
Summarizing, USDCAD is facing some upside pressure above the long-term descending trend line; however, the technical indicators are losing some ground.


