
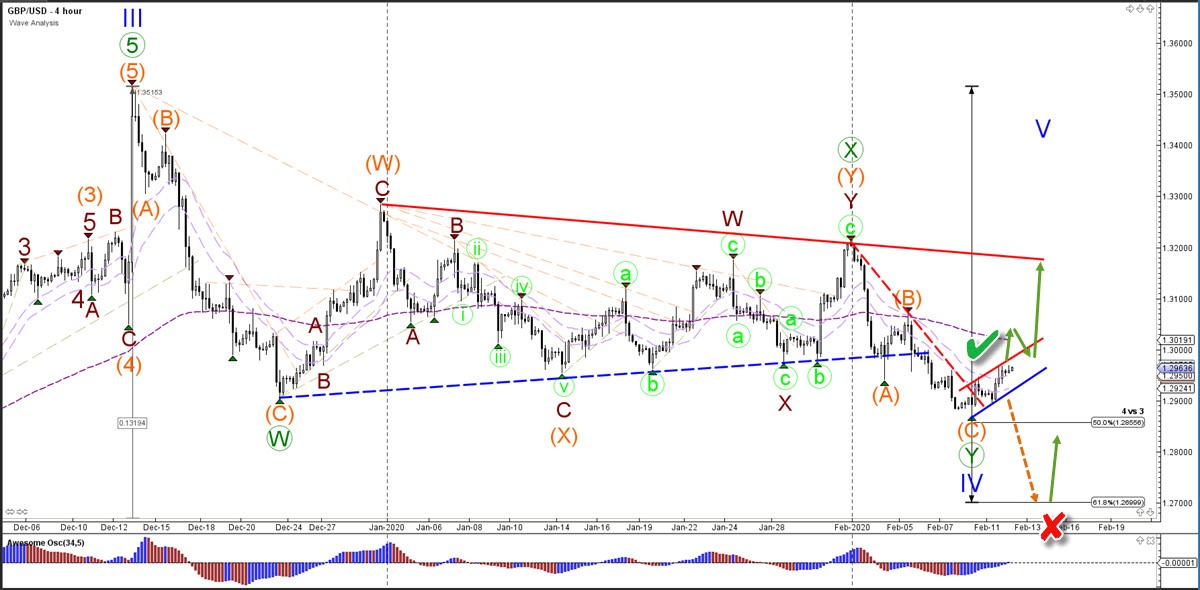
The GBP/USD has been bearish after the break below support (dotted blue). But price action made a bullish bounce at the 50 Fibonacci of wave 4 vs 3. And price also broke above the resistance trend line (dotted red). A break above the channel could confirm (green check) the bullish price swing and reversal.
The GBP/USD break below the 100% Fib invalidates (red x) the bullish reversal. Price is now building an ascending wedge chart pattern. A bullish break above resistance (red) could confirm (green check) the move up. A key break will also be a push above 1.30.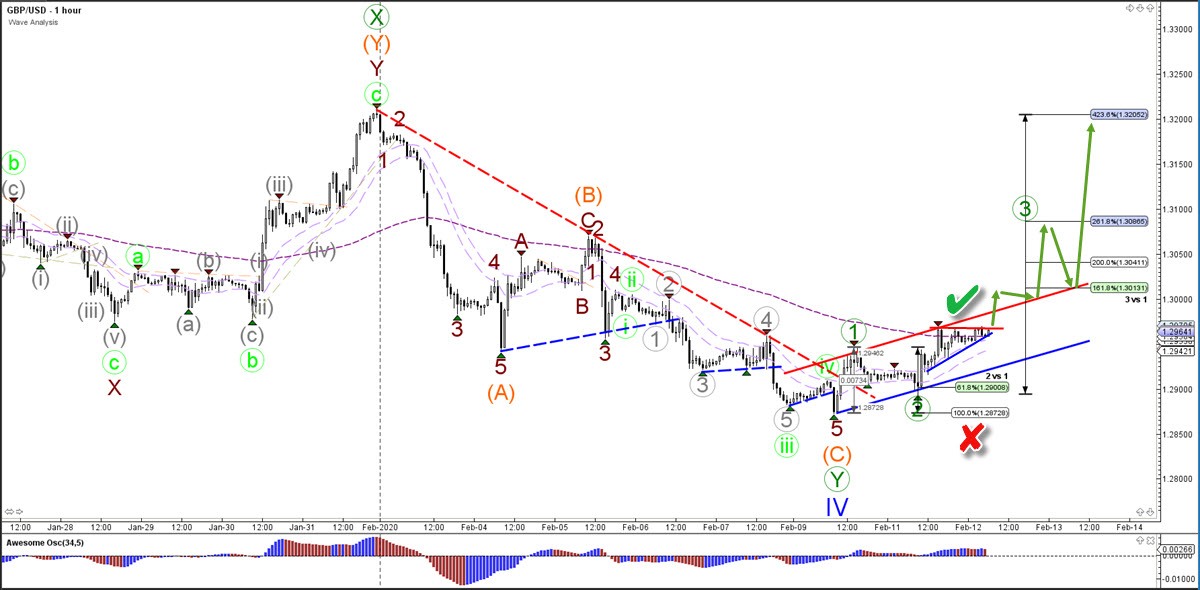


