
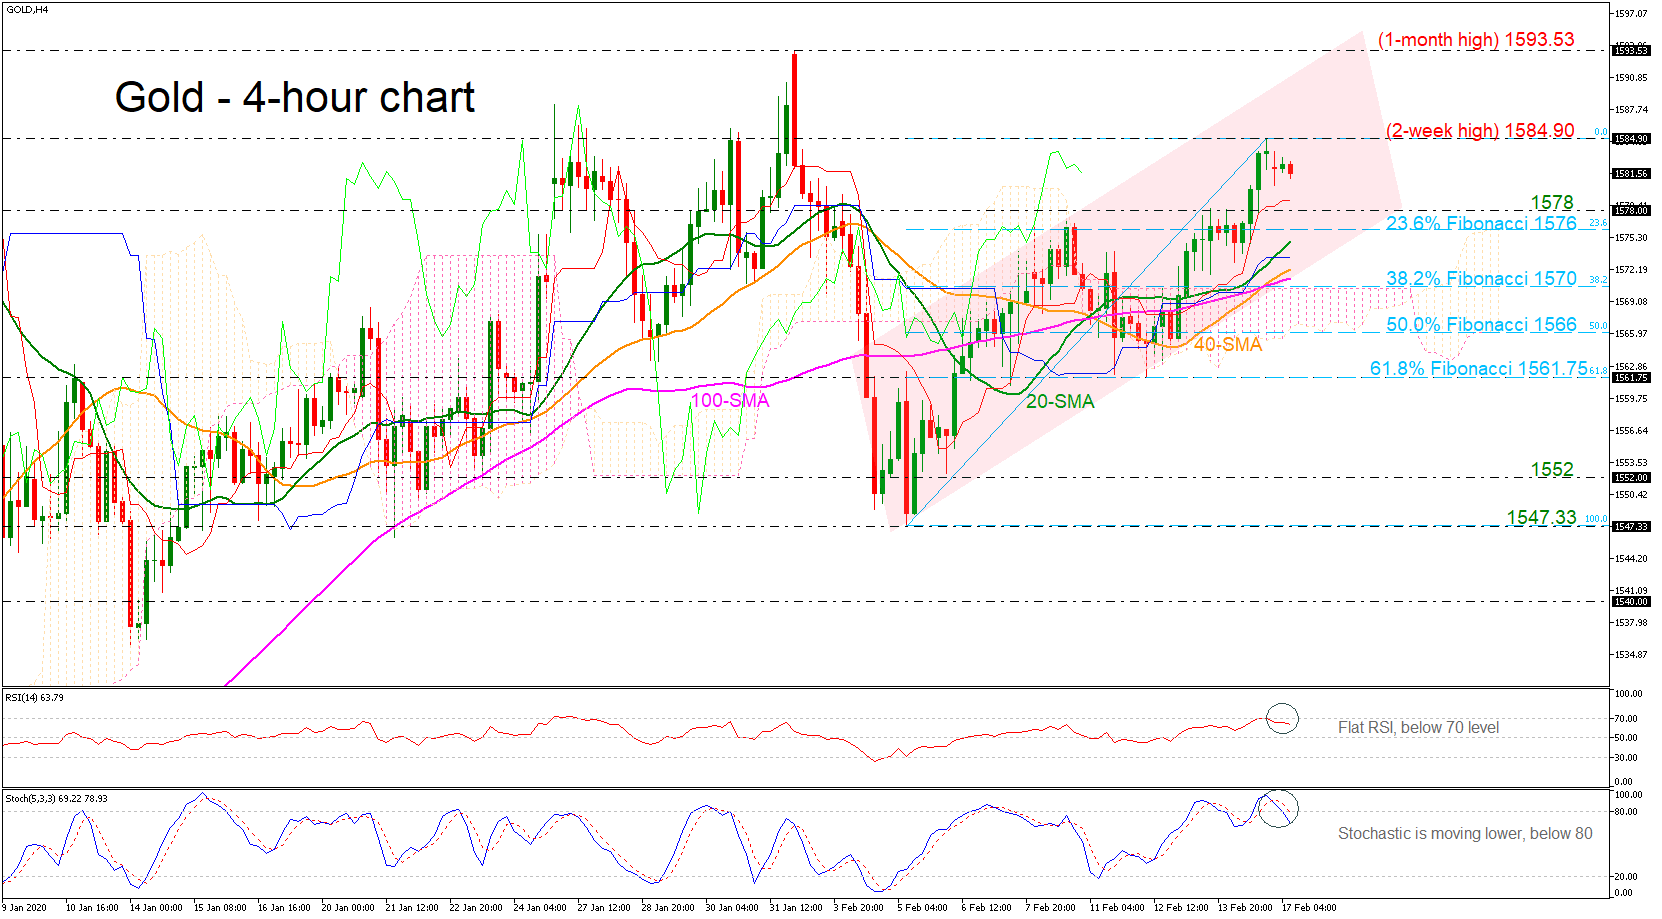
Gold stretched its upside rally to a two-week high of 1,584.90 on Friday before pulling slightly lower in a bullish sloping channel in the 4-hour chart.
Currently, in the near term, the price is losing some momentum confirmed by the technical indicators as the RSI is flattening near the 70 level, suggesting an overbought market. Also, the stochastic oscillator is turning lower as it posted a bearish crossover within its %K and %D lines above the 80 level, signaling a possible downside reversal as well. However, the market trend is holding far above its moving averages and the Ichimoku cloud.
Should the bears take control and the price extend lower, support to downside movements could be initially detected within the 1,578 – 1,576 area, which includes the 23.6% Fibonacci retracement level of the up leg from 1,547.33 to 1,584.90. Clearing that zone, the next stop could be around the 38.2% Fibo of 1,570, which overlaps with the upper surface of the Ichimoku cloud, but first it needs to slip below the 20-, 40-, and 100-period simple moving averages (SMAs). Below that, the 50.0% Fibo of 1,566 is coming into focus.
Alternatively, a jump above the two-week high of 1,584.90 could open the door for more gains towards the one-month high of 1,593.53, reached on February 3. Moreover, the almost seven-year high of 1,611 could serve as strong resistance too, continuing the long-term bullish tendency.
In the very short-term picture, the sentiment is neutral to bearish as the price is flattening below the two-week high. Despite the latest move, the price has been developing within an upward channel since February 5, adding optimism for a brighter outlook.


 Is Testing an Important Resistance Zone")