
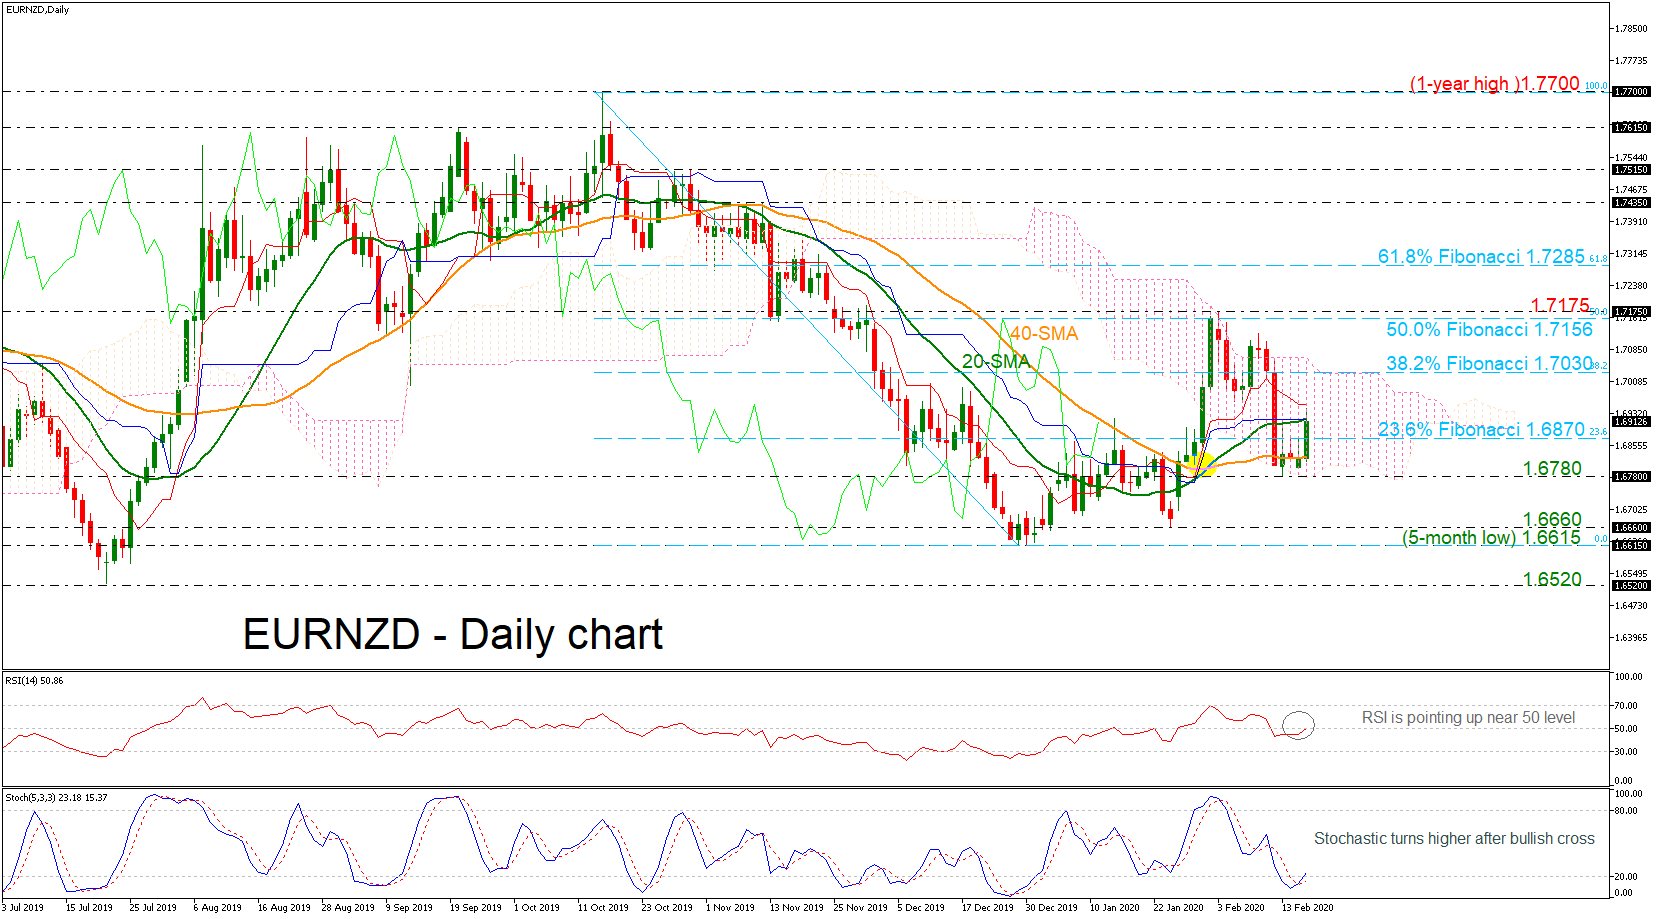
EURNZD has gained little today but it managed to hold within the Ichimoku cloud and the 20- and 40-day simple moving averages (SMAs), with the technical indicators feeding prospects for a possible upside move. The RSI indicator is sloping upwards and is approaching the bullish zone, while the stochastic continues to strengthen after the bullish cross within the %K and %D lines.
If the 20-day SMA at 1.6915 proves easy to get through, the spotlight will turn to the 38.2% Fibonacci retracement level of the down leg from the one-year high of 1.7700 to the five-month low of 1.6615 at 1.7030, which coincides with the upper surface of the cloud. On top of that, the bulls would need to clear the 50.0% Fibo of 1.7156 and the 1.7175 resistances to push the rally towards the 61.8% Fibo of 1.7285.
A failure to overcome the Ichimoku cloud could send the price down to 1.6780, taken from the latest low. Further down, support could be next found around the 1.6660 – 1.6615 support zone, while significant close below this line could trigger a steeper sell-off.
All in all, the market is expected to hold bearish in the medium-term after the bounce off the 1.7700 handle but a successful climb above the 61.8% Fibo of 1.7285 could switch the short-term bias to bullish.


