
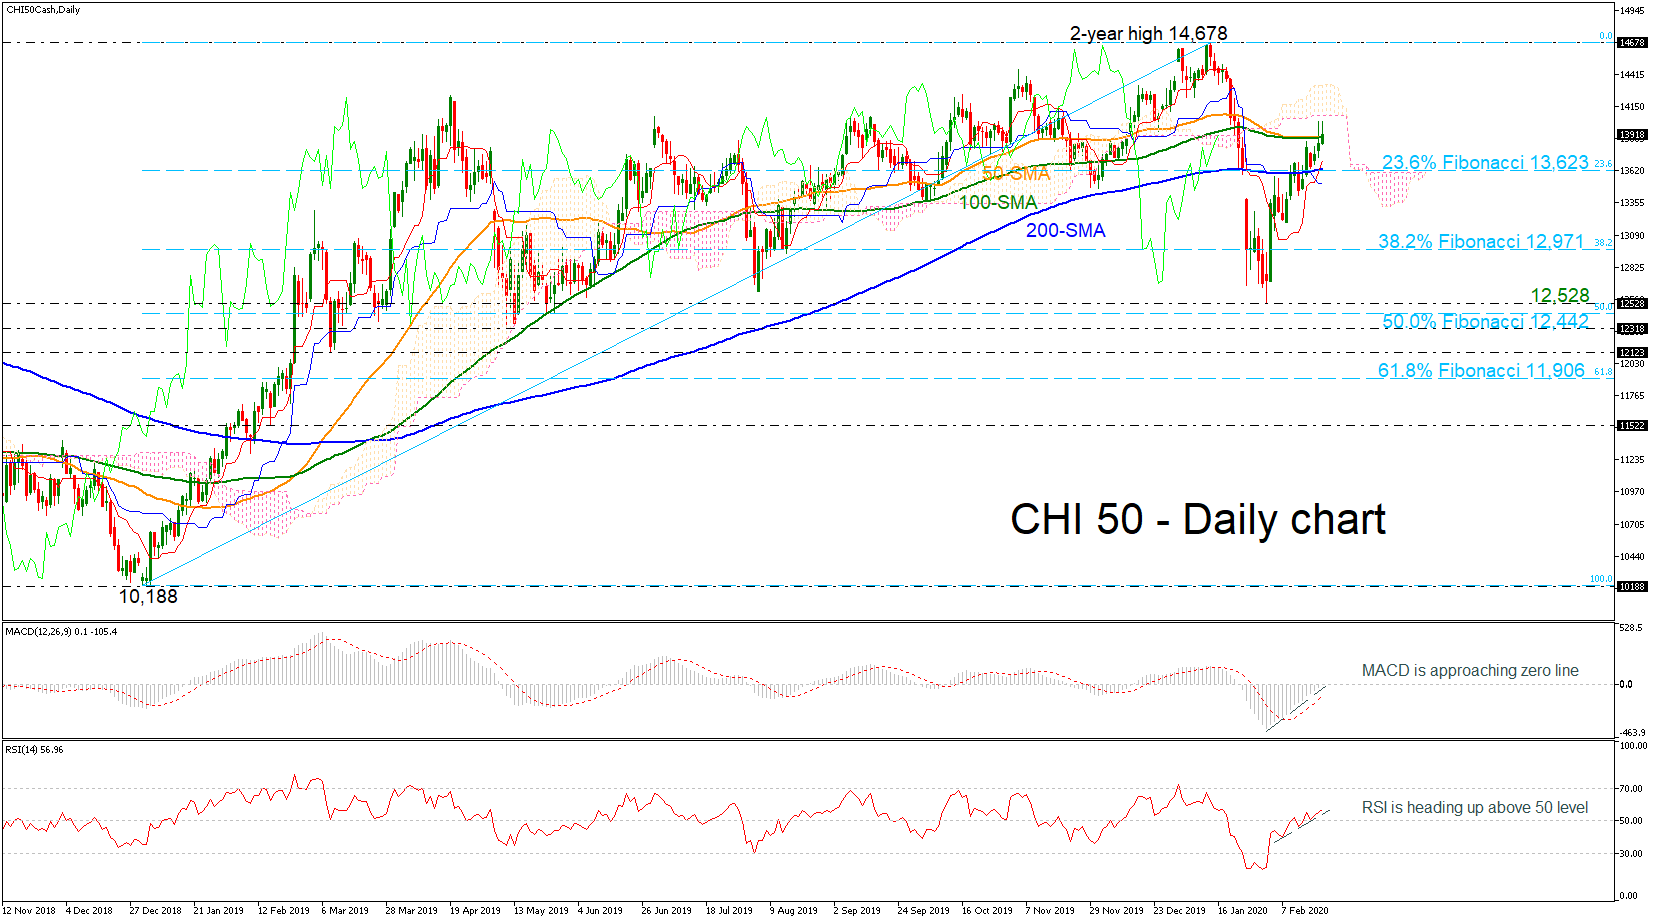
CHI 50 index is capped by the 50- and 100-day simple moving averages (SMAs) and the Ichimoku cloud after the upside recovery from the 12,528 support level. The short-term upside tendency is confirmed by the technical indicators. The MACD is extending its bullish move near the zero line, as it holds above its trigger line. Furthermore, the RSI is heading north in the positive area, while the red Tenkan-sen line is moving higher following the price action.
Should the index stretch upwards, immediate resistance could be provided by the lower surface of the Ichimoku cloud at 14,076. A significant step higher could bring the bullish sentiment into play, paving the way for the two-year high of 14,678.
A reversal to the downside, however, could find support at the 200-day SMA, which coincides with the 23.6% Fibonacci retracement level of the up leg from 10,188 to 14,678 near 13,623. If the latter fails to halt bearish movements, the next target could be the 38.2% Fibonacci of 12,971 ahead of the latest low of 12,528 reached on February 3.
Turning to the medium-term picture, the index could turn strongly bullish only if there is a daily close above the two-year high of 14,678 as the previous downside correction drove the price lower to 12,528, suggesting a somewhat neutral move.


