
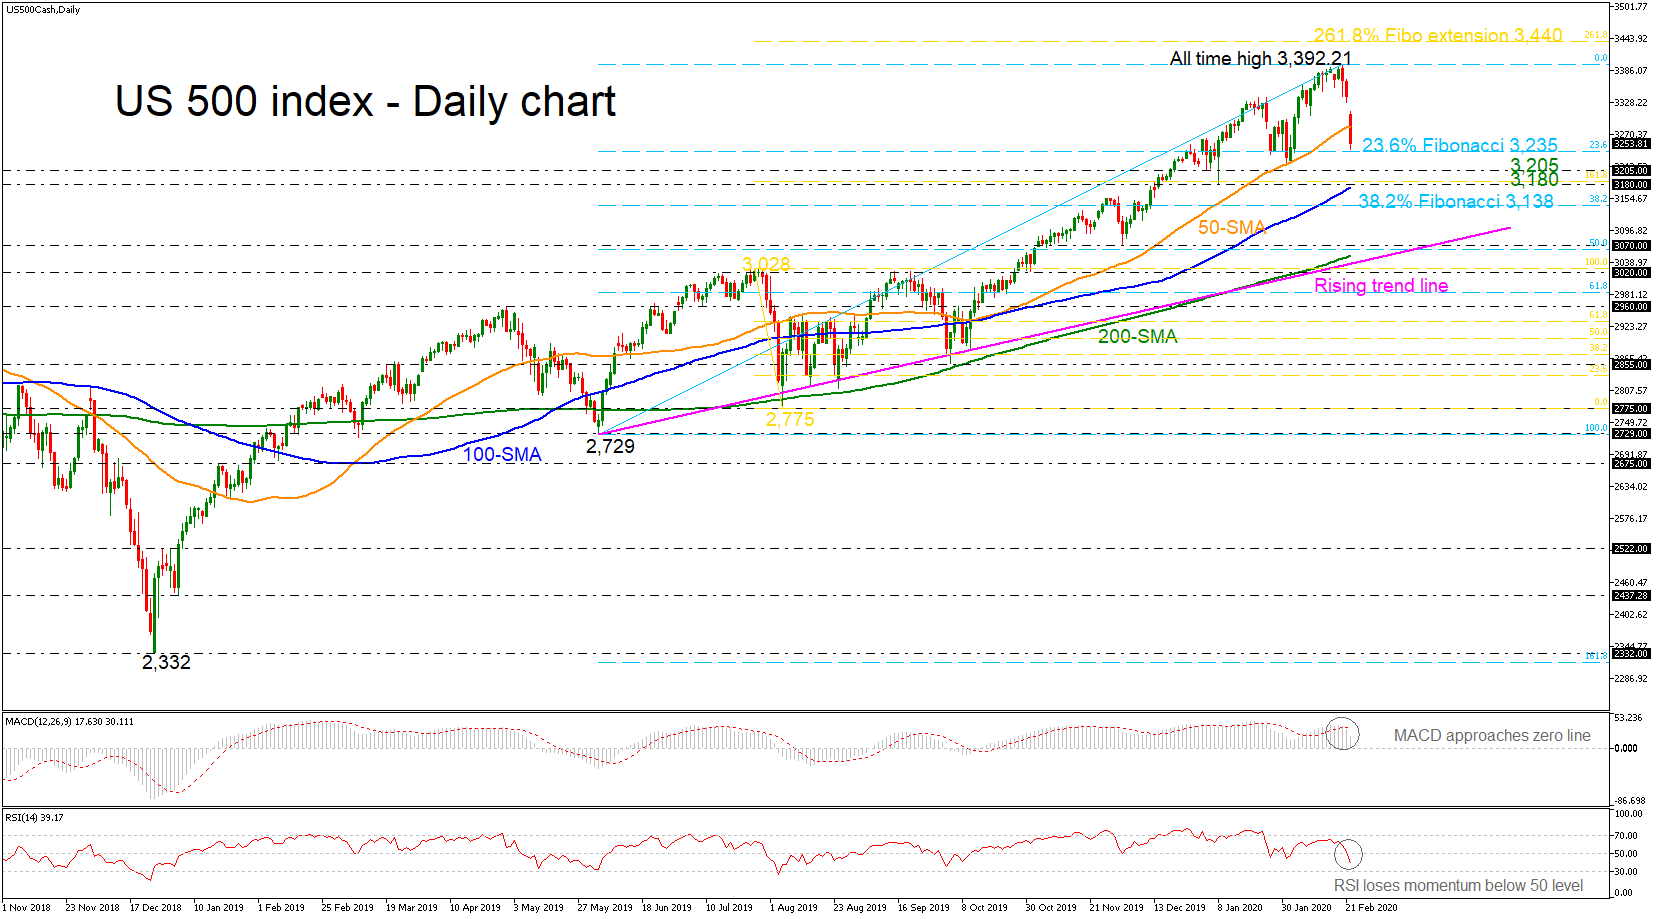
The US 500 index (Cash) declined considerably today after the gap down, retreating beneath the 50-day simple moving average (SMA). The price completed a three-week low at 3,249 with the technical indicators moving south. The MACD is extending its bearish structure below the trigger line, while the RSI dropped in the negative territory, strengthening the negative momentum.
In case of steeper declines, the market could meet immediate support at the 23.6% Fibonacci retracement level of the up leg from 2,729 to 3,392.21 at 3,235. Even lower, the 3,205 and 3,180 obstacles are coming next, which stands near the 100-day simple moving average (SMA) before meeting the 38.2% Fibo of 3,138.
On the other hand, a move to the upside could see immediate resistance at the 50-day SMA currently at 3,285, but should the market increase positive momentum above this area, the record high of 3.392.21 could come in focus. More gains could find resistance at the 261.8% Fibonacci extension level of the down leg from 3,028 to 2,775 near 3,440.
Summarizing, the US 500 stock index could face more upside pressure in the long-term if it surpasses the all-time high. Noteworthy is the price, which has been developing above the ascending trend line since June 2019.


 Favors Upside")


