
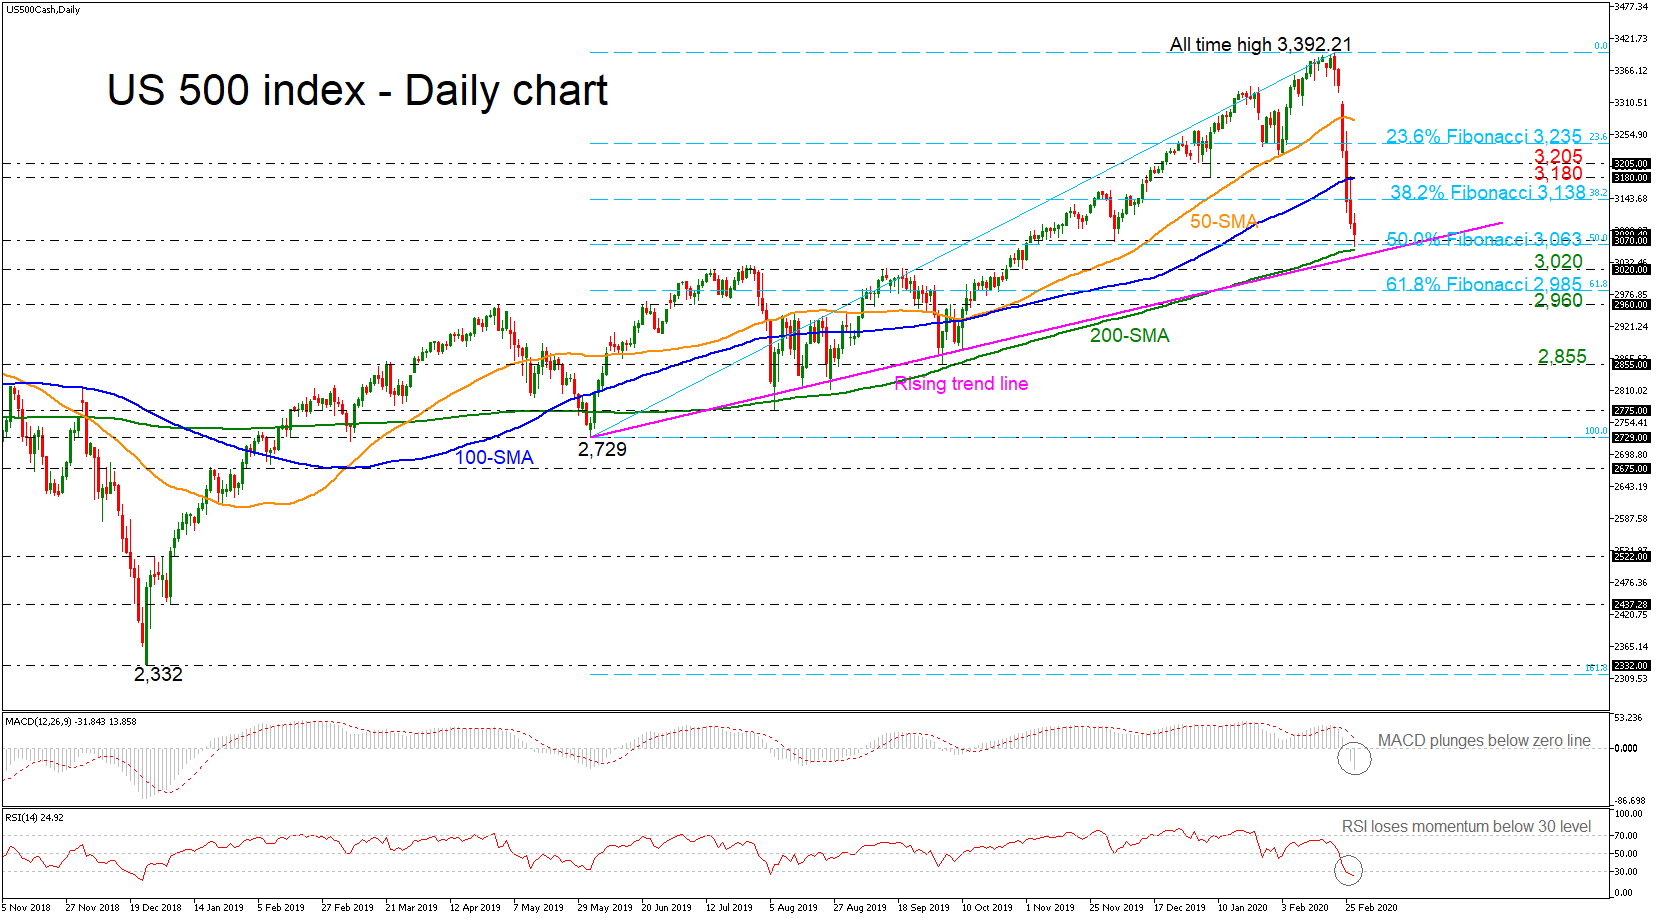
The US 500 index (Cash) has been in free fall mode since February 20 as it hit resistance at the record high of 3,392.21. The price is creating the biggest sell-off run since December 2018 and is approaching the nine-month ascending trend line, posting a fresh four-month low near the 200-day simple moving average (SMA) at 3,060.
From a technical viewpoint, the moving averages are pointing down, while the MACD oscillator sank to the negative territory with strong momentum. Moreover, the RSI slipped to the oversold area and it seems ready for a possible upside correction in the short-term.
If the bears continue to gain strength and slip beneath the 200-day SMA and the strong rising trend line near 3,050, they could find immediate support at the 3,020 region. More aggressive declines could shift the long-term view to neutral, flirting with the 61.8% Fibonacci retracement level of the up leg from 2,729 to 3,392.21 at 2,985 and the 2,960 level. A clear dip below this line, would bring the index towards the 2,855 zone, taken from the bottom on October 2019.
Should the price rebound on the diagonal line, the 38.2% Fibo of 3,138 could provide resistance before it touches the 100-day SMA at 3,180. Marginally above this, the market could meet 3,205 and the 23.6% Fibo of 3,235, retaining a bullish view.
To sum up, the picture is still positive in the long-term timeframe, however, in the short-term, the bearish moves over the last five days signal a potential downside correction if the US 500 penetrates the 2,960 support.


