
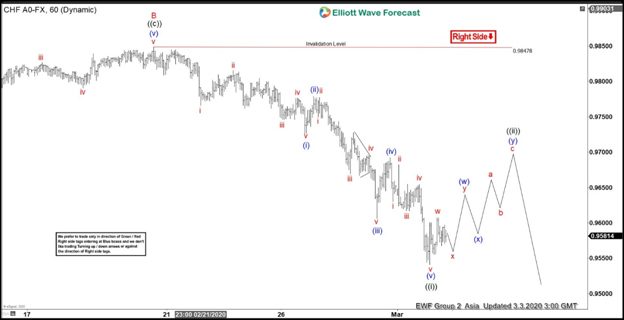
USDCHF shows an incomplete sequence from April 2019 peak favoring further downside and rally to fail in 3, 7, 11 swing. In the short term chart below, the bounce to 0.985 ended wave B and pair has resumed lower in wave C. The internal subdivision of wave C is unfolding as a 5 waves impulse Elliott Wave structure. Down from 0.985, wave (i) ended at 0.9726 and bounce in wave (ii) ended at 0.9778. Pair then resumed lower again in wave (iii) towards 0.9606, wave (iv) bounce ended at 0.969, and finally wave (v) ended at 0.954. The 5 waves move lower ended wave ((i)) of C in higher degree.
Pair is now expected to correct cycle from February 20, 2020 high within wave ((ii)) before the decline resumes. We do not like buying the proposed rally. Expect bounce to fail in the sequence of 3, 7, or 11 swing and pair to extend lower. As far as pivot at 0.984 high remains intact in the rally, we should see further downside in the pair. Potential minimum target to the downside is 100% Fibonacci extension from April 2019 high which comes at 0.935 – 0.948 area.
USD/CHF 1 Hour Elliott Wave Chart


