
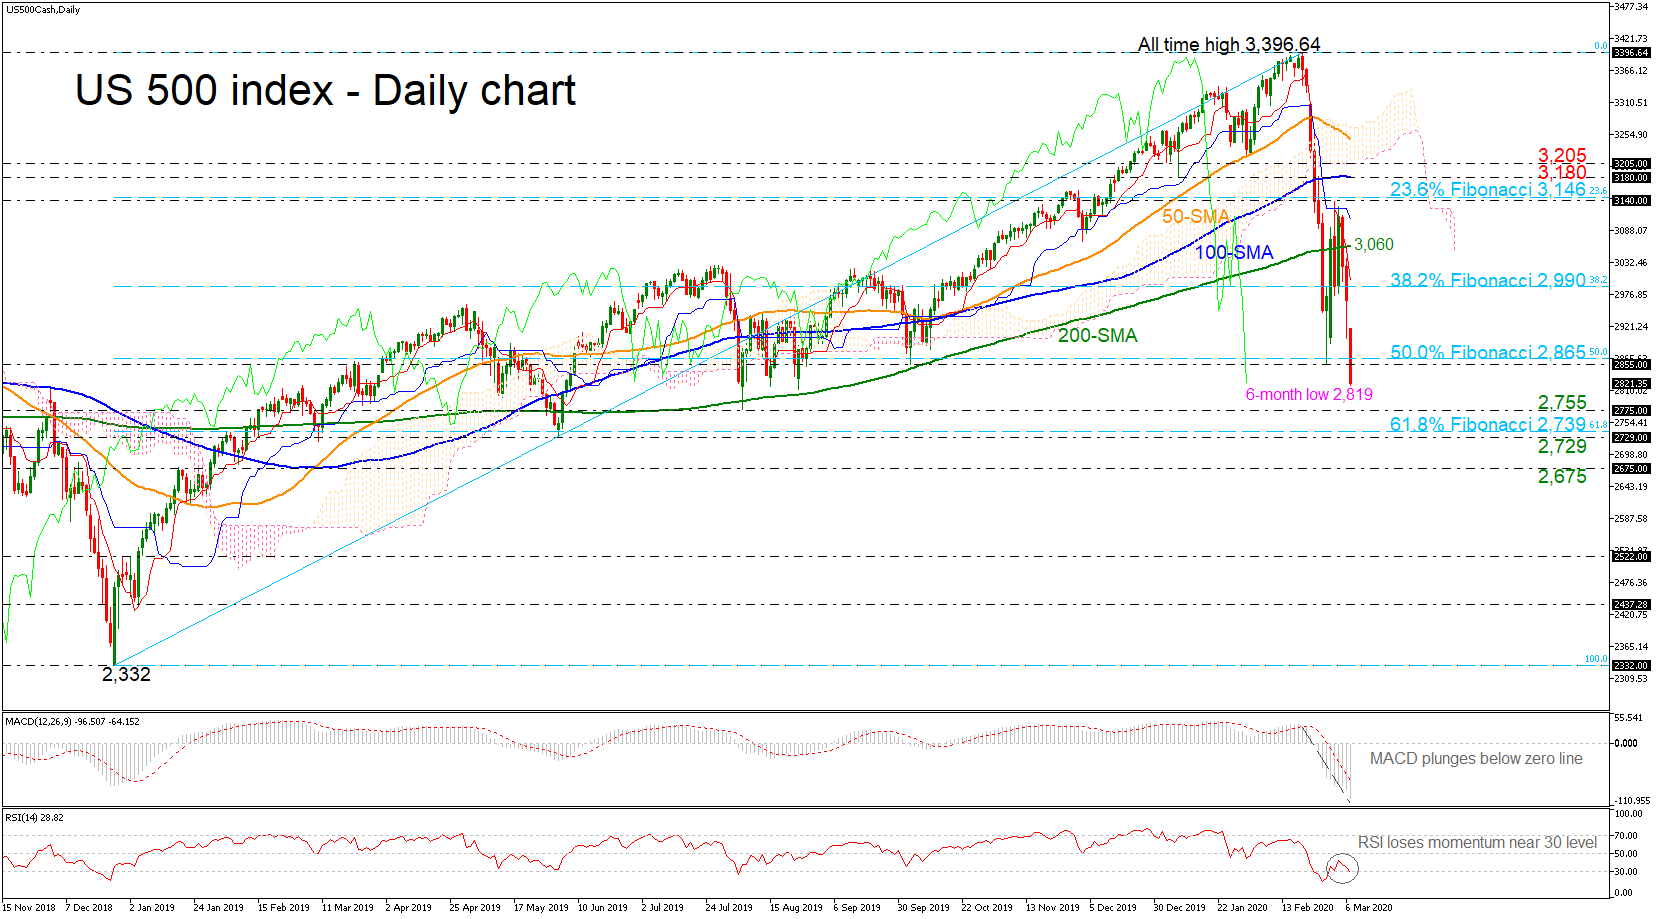
The US 500 index (Cash) continues the sharp sell-off, extending its negative momentum towards a six-month low of 2,819. The outlook turned negative in the short-term with the MACD oscillator holding well below the trigger line in the bearish area, while the RSI is approaching the oversold zone with strong momentum. Also, the red Tenkan-sen line is moving south beneath the blue Kijun-sen line, suggesting a bearish structure.
If traders continue to sell, they could find immediate support at the 2,755 region, achieved on August 2019. Shifting the long-term view to neutral may come from more aggressive declines which could flirt with the 61.8% Fibonacci retracement level of the up leg from 2,332 to 3,396.64 at 2,739 and the 2,729 nearby support. A clear dip below this line, would bring the index towards the 2,675 zone, taken from the inside swing high on January 2019.
Should the price turn up, the 2,855 resistance and the 50.0% Fibonacci of 2,865 could step into the spotlight. Above these, the market may meet the 38.2% Fibo of 2,990 ahead of the 200-day simple moving average (SMA) currently at 3,060.
To sum up, the picture is turning to neutral in the long-term timeframe and negative in the short-term.


