
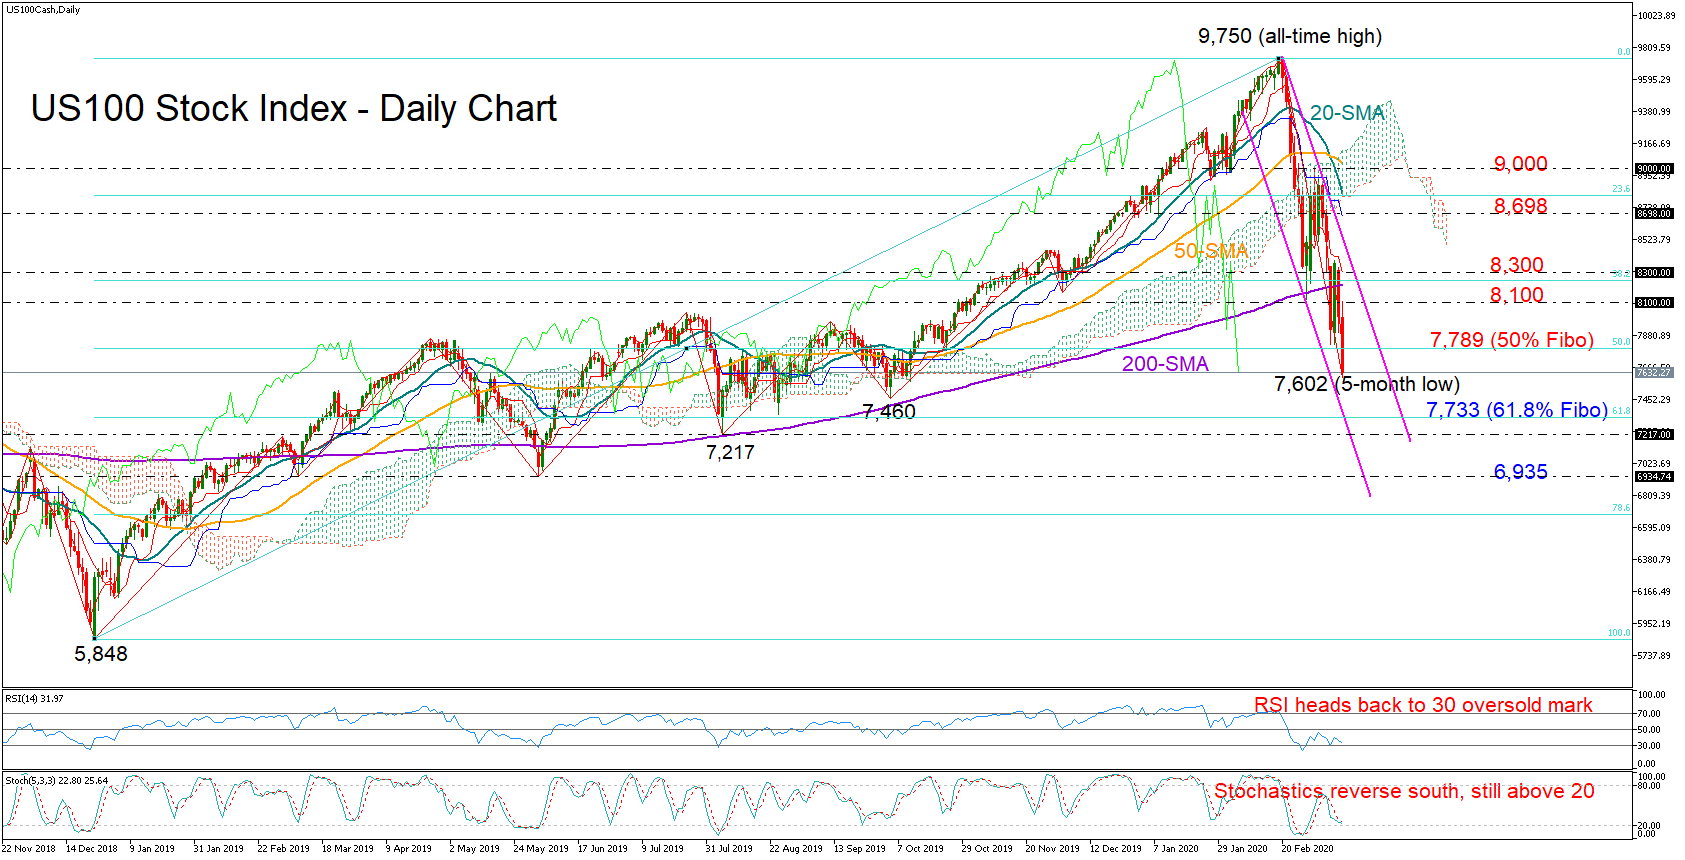
The US 100 stock index (cash) could not successfully breach the 200-day simple moving average (SMA) as the 8,300 resistance level stood tall, with the index pulling back below that line and towards a five month low of 7,602.
Also, the price dropped below 7,789, which is the 50% Fibonacci retracement of the 5,838-9,750 long-term upleg, increasing speculation that the sell-off may not bottom out in the near-term as the downward-sloping RSI and Stochastics are currently signaling.
Probably the next pause could take place around the 61.8% Fibonacci of 7,337 and the bottom of the steep channel. Falling lower and beneath the August low of 7,217, the way would open towards the 6,935 number where the price paused several times in the past.
Should the price reverse north, the bulls may get congested within the 8,100-8.300 area, testing the surface of the channel and the 38.2% Fibonacci too. A decisive close above the channel could see a re-test of the blue Kijun-sen line that proved a tough obstacle recently before resistance around 9,000 comes into view.
Regarding the market’s bullish structure in the bigger picture, it is at risk as the sell-off is heading for a close below the previous low of 7,460.
In brief, the US 100 stock index is holding a bearish short-term bias, while in the bigger picture the price needs to close below 7,460 to violate the long-term uptrend.


