
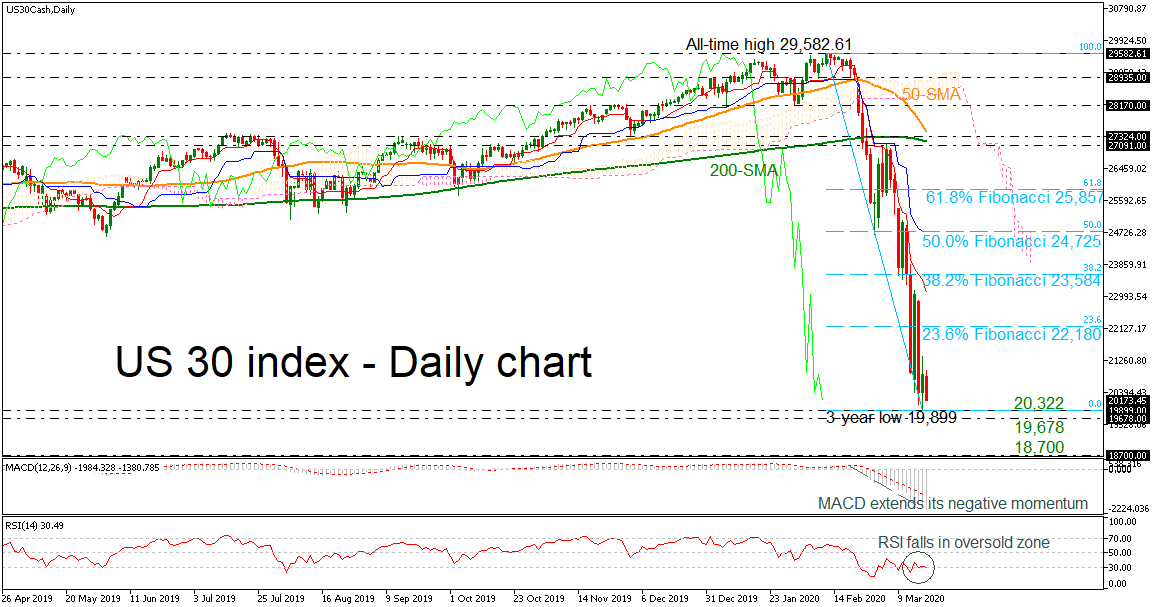
The US 30 index stretched its one-month rally to a three-year low of 19,899 on Tuesday before pulling slightly higher.
The MACD seems to be losing momentum below its red trigger line, while the RSI is still hovering around its 30 oversold mark. Moreover, the red Tenkan-sen line is sloping down below the blue Kijun-sen line, thus all signaling a more cautious trading in the short term. Additionally, the 50- and the 200-day simple moving averages (SMAs) are in the process of completing a ‘death cross’.
The market trend is likely to hold to the downside if the price remains far below its moving averages and the Ichimoku cloud.
Should weakness extend below the three-year low of 19,899, support to downside movements could be initially detected within the 19,678-20,322 area. Clearing that zone, the next stop could be around 18,700, identified on August 2016.
Alternatively, if the price rebounds on the recent low, it is likely to meet a key barrier at the 23.6% Fibonacci retracement level of the downward wave from 29,582.61 to 19,899 at 22,180. Above that, the 38.2% Fibonacci of 23,584 could act as resistance too before a more important battle starts near the 50.0% Fibonacci of 24,725, which overlaps with the blue Kijun-sen line.
In the short-term picture, the sentiment turned bearish after the price plunged below the 27,091 barrier. The negative slope in the 50-day SMA, which moves closer to the 200-day SMA, also confirms the bearish outlook.


