
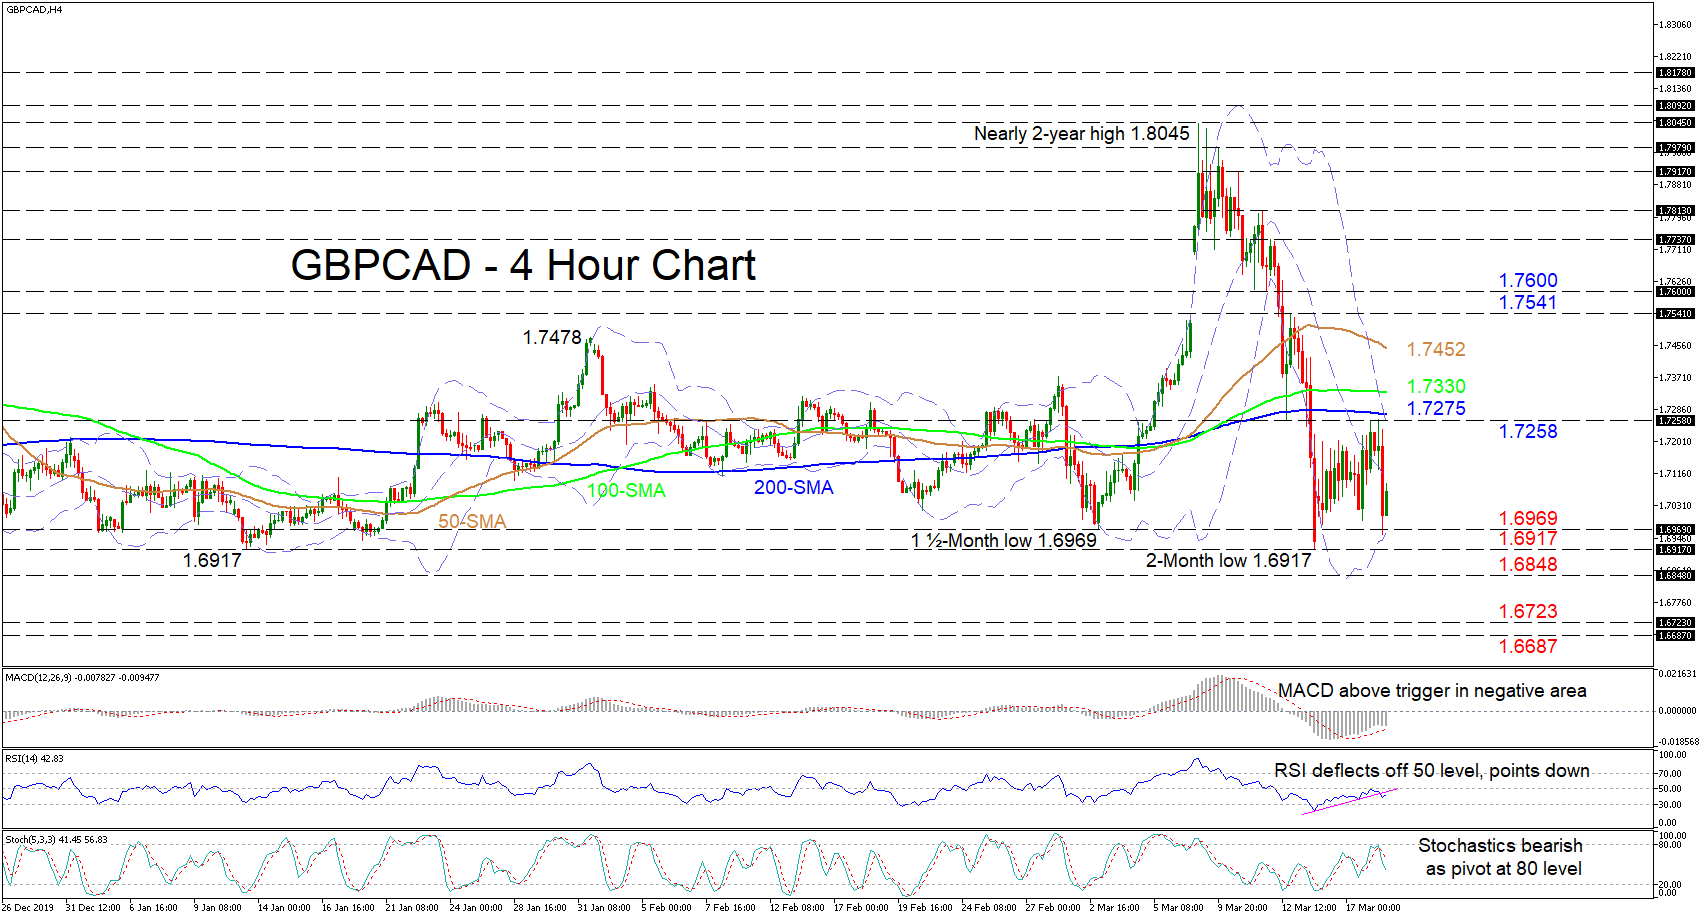
GBPCAD seems to be undecided after the descent from the 1.8045 top, as the pair finds itself squeezed by the upper Bollinger band coupled by the 200-period simple moving average (SMA) and the lower band.
The short-term oscillators reflect a pause in the market but lean towards a negative picture. The MACD, in the negative area, is above its red trigger line but looks to reclaim it, while the RSI, despite having deflected off its neutral mark and moving below the trend line, shows slight improvement. Moreover, the Stochastics bearish crossover has room towards the downside.
If sellers manage to retake control, immediate support could come from the 1.6969 hurdle and the lower Bollinger band marginally beneath. Moving down, the bears could revisit the two-month low of 1.6917 and if it gives way, move towards the 1.6848 obstacle from November 7. A dive south could see downside movements challenged around the 1.6723 trough from back in October and the 1.6687 lower barrier.
Otherwise, if buyers steer above the mid-Bollinger band, this could accelerate the price towards the 1.7258 swing high area, where the upper Bollinger band and the 200-period SMA at 1.7275 also reside. Overtaking the 200-period SMA, the 100- and 50-period SMAs at 1.7330 and 1.7452 respectively could impede the pair from stretching to the swing high of 1.7541 and inside swing low at the 1.7600 psychological number.
Overall, the near-term is confined between the 1.7258 and 1.6917 levels and a break either above or below could reveal the next direction. Moreover the break below 1.6917 could throw into question the medium-term positive picture from the 1.5874 low.


