
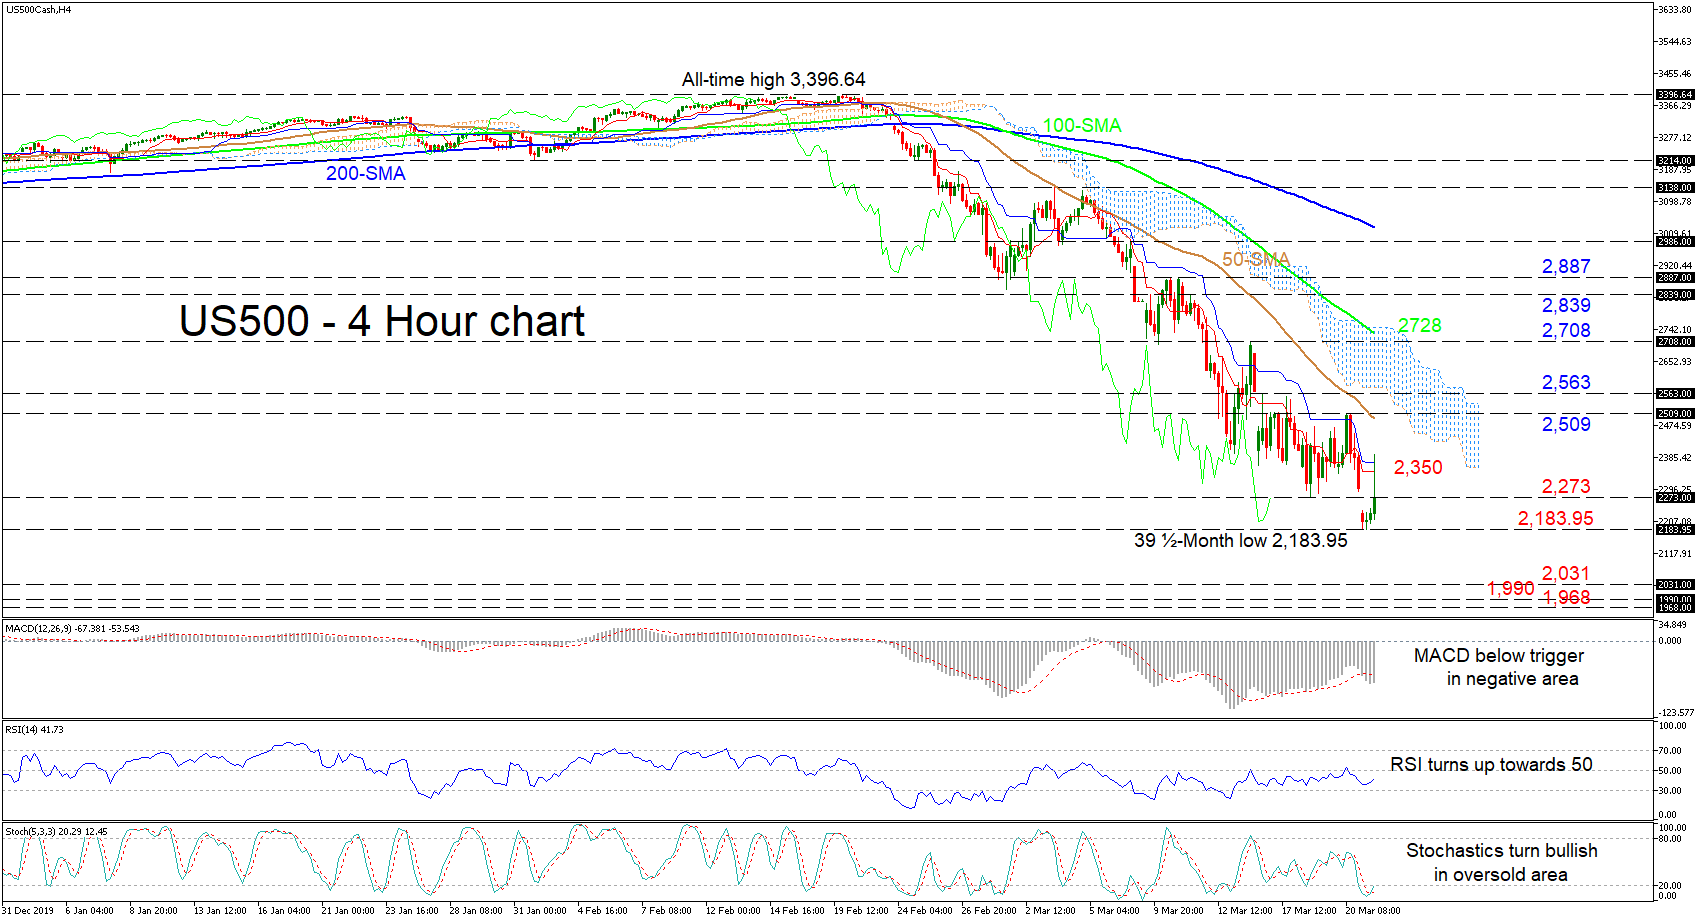
US 500 index (Cash) gapped today underneath the inside swing low of 2,273 reaching a multi-year low of 2,183.95 before buyers surfaced, steering the price back up towards the 2,350 area, where the flat Ichimoku lines are located.
The short-term oscillators, although negative, reflect some strengthening in positive momentum. The MACD, in the negative zone, is below its red trigger line but looks to be moving back above it. The RSI, in the bearish region, is rising towards its neutral mark, while the Stochastics have completed a bullish cross exiting the oversold territory. Noteworthy, is the downward sloping simple moving averages (SMAs) and the sustained bearish mode within them and the Ichimoku lines, which back the strong bearish descent.
Should the index decline further, first support could come from the 2,273 inside swing low before the index revisits the fresh 39½-month mark of 2,183.95. Diving beneath this hurdle, the bears face an area of congested supports, starting with the 2,031 level from November 2016, followed by the 1,990 and 1,968 barriers stretching back to June and March of 2016.
Heading north above the Ichimoku lines, the 2,509 high – where the 50-period SMA also resides – could apply initial resistance ahead of the 2,563 level. Slightly higher, the lower band of the Ichimoku cloud could deter the price from climbing towards the 2,708 swing high. Surpassing this and the nearby upper band of the cloud, coupled with the 100-period SMA, the bulls could jump to challenge the 2,839 and 2,887 barriers.
Summarizing, the short-term picture remains negative as the price holds below the cloud and SMAs, but more importantly below the 2,887 barrier.


