
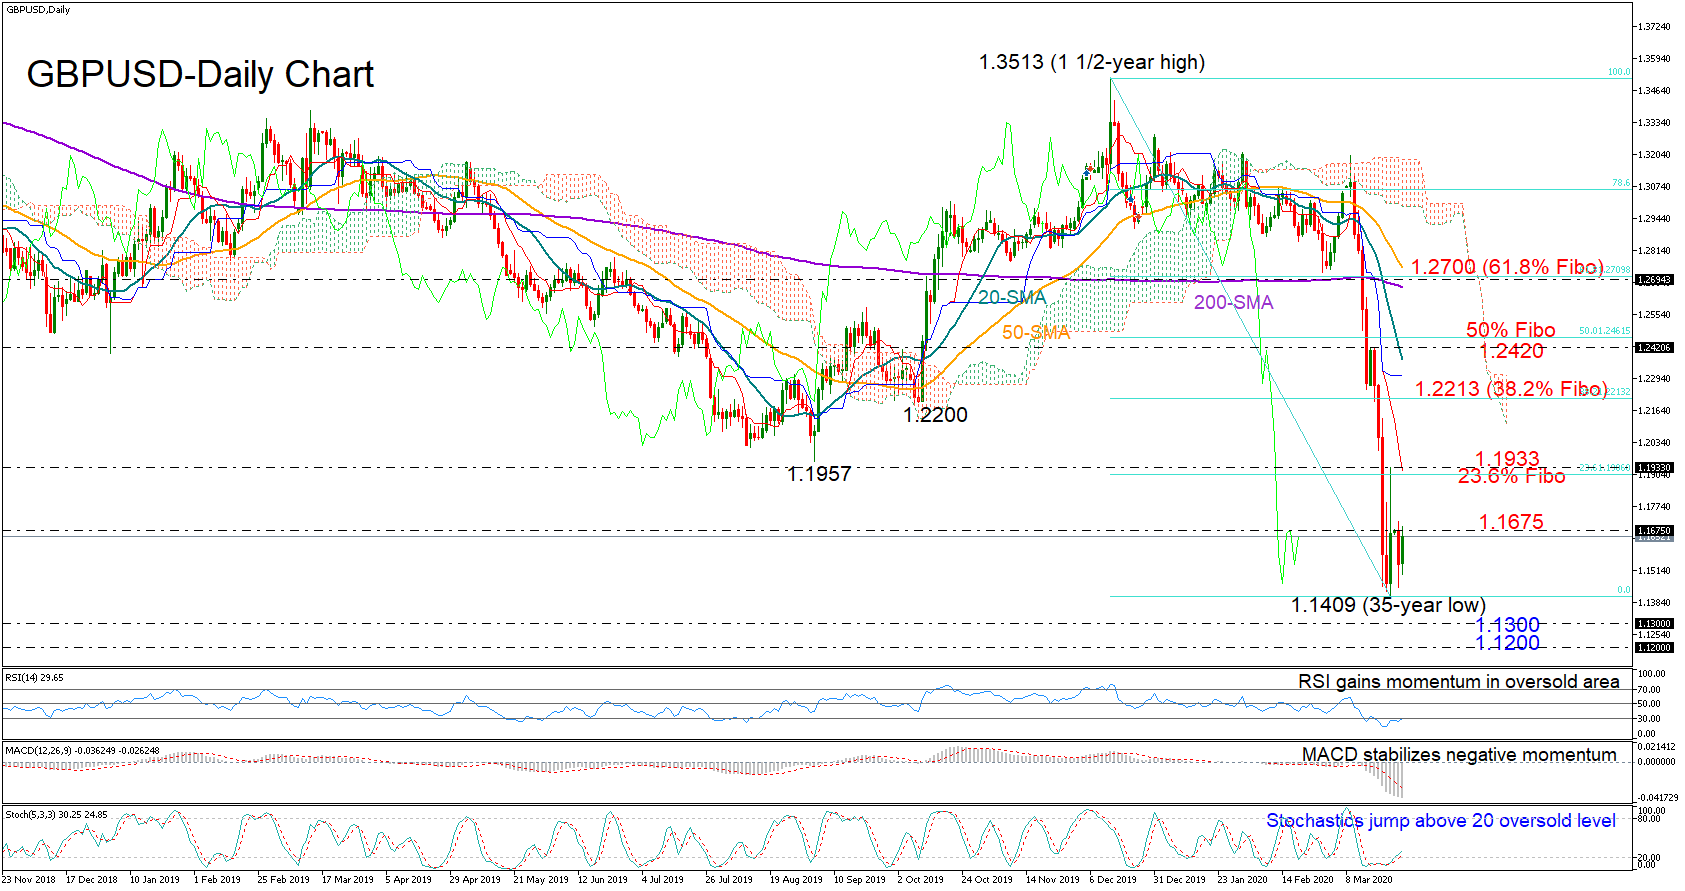
GBPUSD has been consolidating losses since the day it plunged to a 35-year low of 1.1409, unable to close above the 1.1675 barrier too.
The momentum indicators, though, are currently encouraging that the sell-off may have found a bottom and the pair may be pushing for some recovery. The RSI and the Stochastics are pointing up and are ready to leave the oversold zone, while the MACD seems to be stabilizing in the negative area, and in Ichimoku indicators, the blue Kijun-sen has also paused its downside move.
Practically speaking, a closing price above 1.1675 and more importantly above Friday’s high of 1.1933, where the 23.6% Fibonacci of the down leg 1.3315-1.1409 and the red Tenkan-sen line are located, could boost buying interest and confirm additional gains towards the 38.2% Fibonacci of 1.2213. Higher still, the 1.2420 which is marginally below the 50% Fibonacci could also react as resistance.
In the event of a pullback below 1.1675, the bears may push harder to clear the 1.1409 floor and head for the 1.1300 and 1.1200 psychological levels.
Meanwhile in the medium-term picture, the outlook remains strongly bearish following this month’s free-fall, with traders waiting a rally above 1.2700 level to eliminate fears of a down-trending market.
In brief, GBPUSD seems to be searching for a recovery, though only a closing price above the 1.1675-1.1933 territory would convince that the worst has passed, at least in the short-term. Medium-term traders could stay cautious unless the price breaks above 1.2700.


