
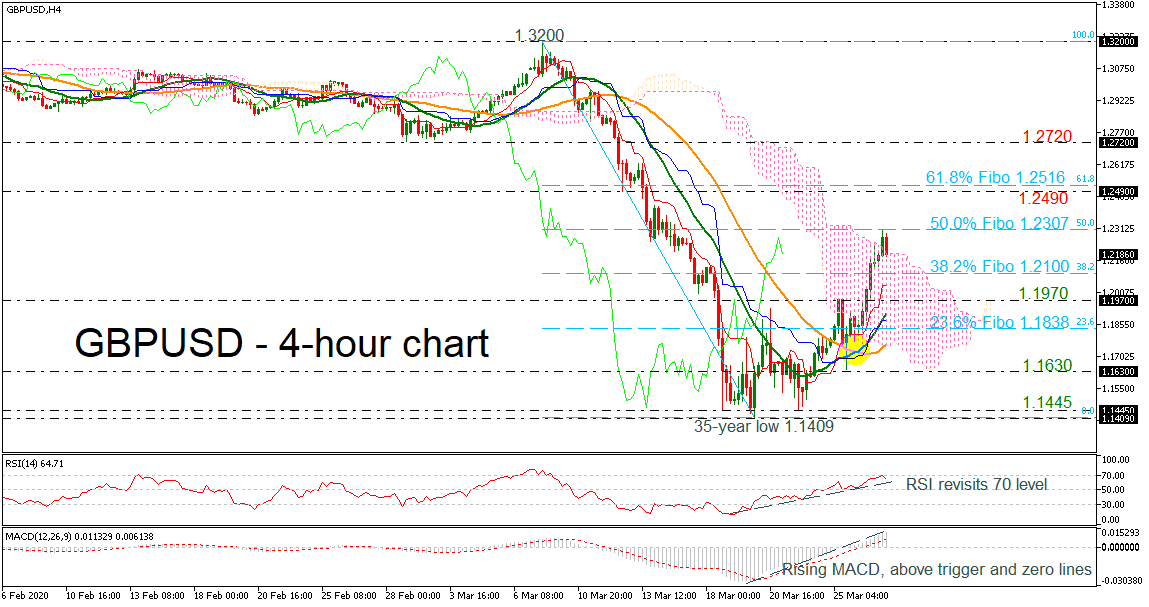
GBPUSD looks to be creating a floor above the Ichimoku cloud and slightly below the 50.0% Fibonacci retracement level of the downward wave from 1.3200 to 1.1409, near 1.2307. The bullish crossover of the 20- and 40-period simple moving averages (SMAs) is confirming the recent upside correction in the 4-hour chart after the aggressive dive towards the 35-year low of 1.1409.
Technically, the RSI indicator is turning slightly lower after it visited the 70 level in the near-term and the MACD oscillator is still extending its movement above its trigger and zero lines.
Traders would be more eager to engage in buying activities if the price manages to surpass the nearby resistance at the 50.0% Fibonacci of 1.2307. If this is successfully breached, then the rally may next rest somewhere between the 1.2490 resistance and the 61.8% Fibonacci of 1.2516, while a close above this area may be needed to push the price towards the 1.2720 barrier, taken from the inside swing low on February 28.
On the flip side, the selling pressure could accelerate again if the market deteriorates below the Ichimoku cloud and the 1.1445 support. But first it needs to drop below the 38.2% Fibonacci of 1.2100, the 1.1970 support and the 23.6% Fibonacci mark of 1.1838. Such a move could next bring the 1.1630 barrier under the spotlight ahead the strong 1.1409 – 1.1445 zone.
Summarizing, GBPUSD is expected to show some minor improvement if the price overcomes the 61.8% Fibonacci of 1.2516. In the medium-term a stronger push up from the 35-year trough of 1.1409 is required to upgrade the negative outlook.


