
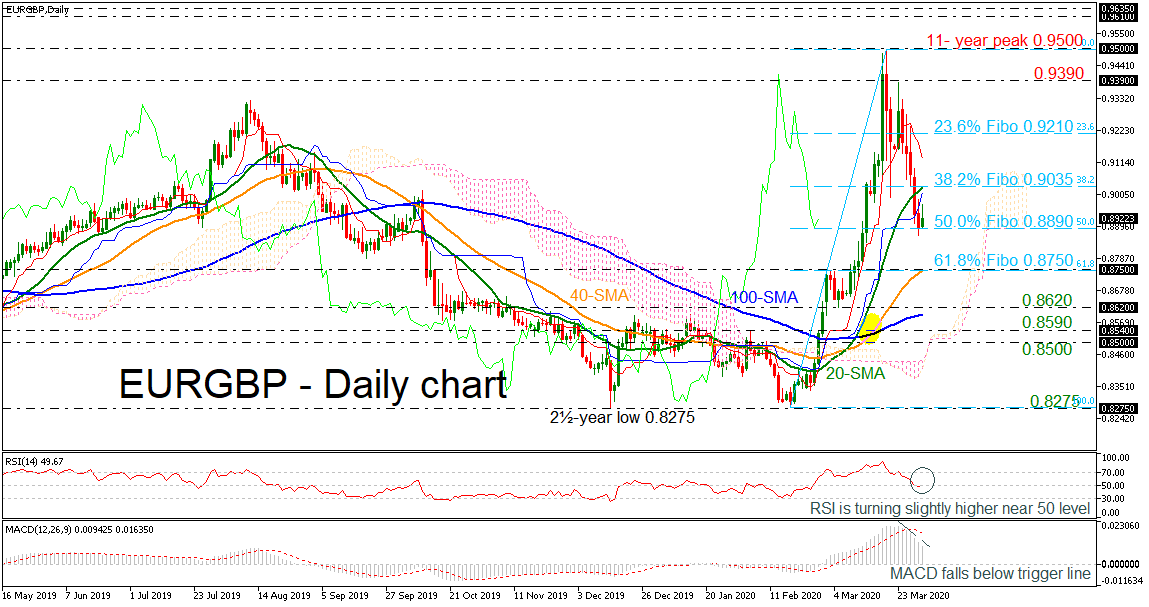
EURGBP finally found some footing near the 50.0% Fibonacci retracement level of the up leg from 0.8275 to the eleven-year high of 0.9500 at 0.8890 and questions are rising whether the market can sustain the dive from the multi-year peak.
The negative slope in the MACD, which runs comfortably below its trigger line, is painting a negative story for the short-term trading. However, with the RSI aiming for a jump above the 50-neutral level, it is reasonable to believe that Tuesday’s positive start may remain short-lived. Noteworthy, the 20- and 40-day simple moving averages (SMAs) posted a bullish crossover with the 100-day SMA in the previous sessions, but currently the lines are changing direction and look to turn flat.
The 38.2% Fibonacci mark of 0.9035 is the nearest resistance, which overlaps with the 20-day SMA and the Ichimoku cloud that could reject any attempt higher. If not, the price could extend positive momentum, and the 23.6% Fibonacci at 0.9210 could take over ahead of the 0.9390 barrier.
On the flip side, a downside move below the 50.0% Fibo could bring the 0.8750 support, which is the 61.8% Fibo and coincides with the 40-day SMA, back into view. Should it fail to hold, 0.8620 and the 100-day SMA at 0.8595 could be the next targets, while steeper declines could reach the 0.8590 – 0.8500 support area, where any violation would raise fears over a down-trending market.
In the medium-term window, the sentiment is turning neutral following the breakdown from 0.9500. A closing price above this level could confirm the reversal back to a positive outlook, while a fall beneath 0.8275 could open the way for a stronger sell-off.


