
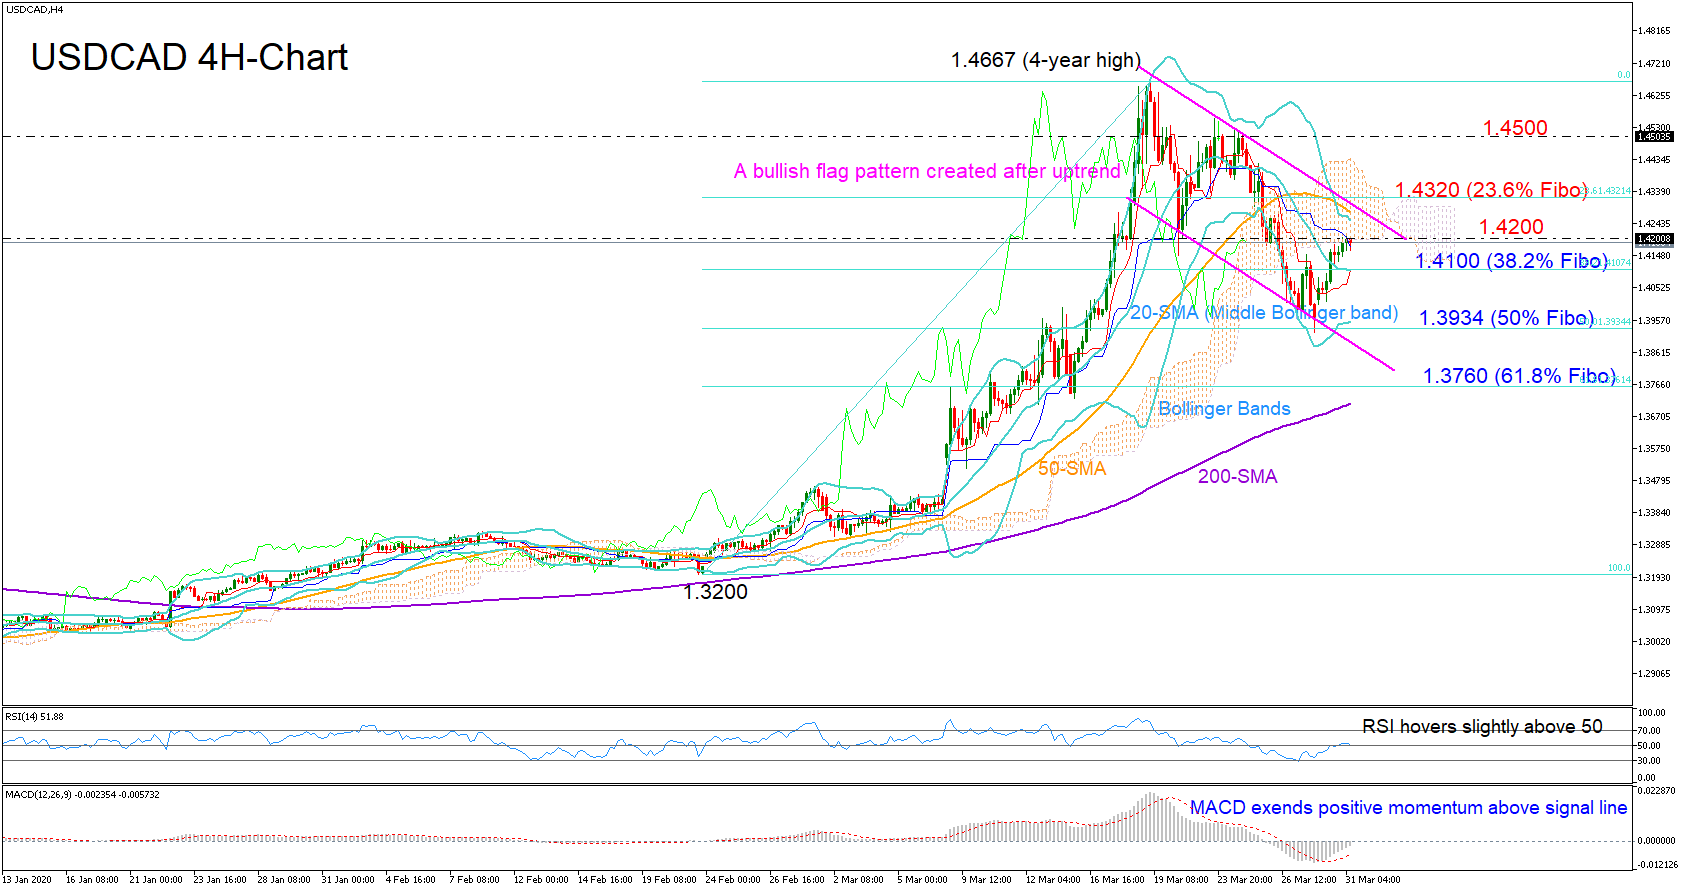
USDCAD has been congested within a downward-sloping channel on the four-hour chart over the past two weeks that seems to be part of a bullish flag formation. Technically, the pattern is a positive trend signal that the price will resume its upward direction once it breaks above the flag.
The fact that the price has jumped above the middle Bollinger band which is also the 20-period simple moving average (SMA) suggests that the market could push towards the upper band and the top of the channel. The rising RSI and the strengthening MACD combined with the upward-sloping red Tenkan-sen line are backing this view as well.
The 1.4200 level, however, looks a hurdle for the bulls at the moment. Should it fail to hold, the pair may attempt to pierce above the channel and the 23.6% Fibonacci of 1.4320 of the 1.3200-1.4667 upleg. Climbing higher, the 1.4500 resistance could come in defense ahead of the 1.4667 peak, where any violation would cement the current positive trend signals.
In case the 1.4200 barrier stands tall and sellers take over, the 38.2% Fibonacci of 1.4100 could prevent any correction towards the base of the channel, where the 50% Fibonacci of 1.3934 is also placed. Closing out of the channel, the decline could stretch towards the 61.8% Fibonacci of 1.3760.
Summarizing, USDCAD is expected to challenge the upper surface of the downward sloping channel in the short-term if the 1.4200 levels allows more upside to take place. A closure higher could validate a bullish flag formation, simultaneously confirming a trend improvement in the coming sessions.


