
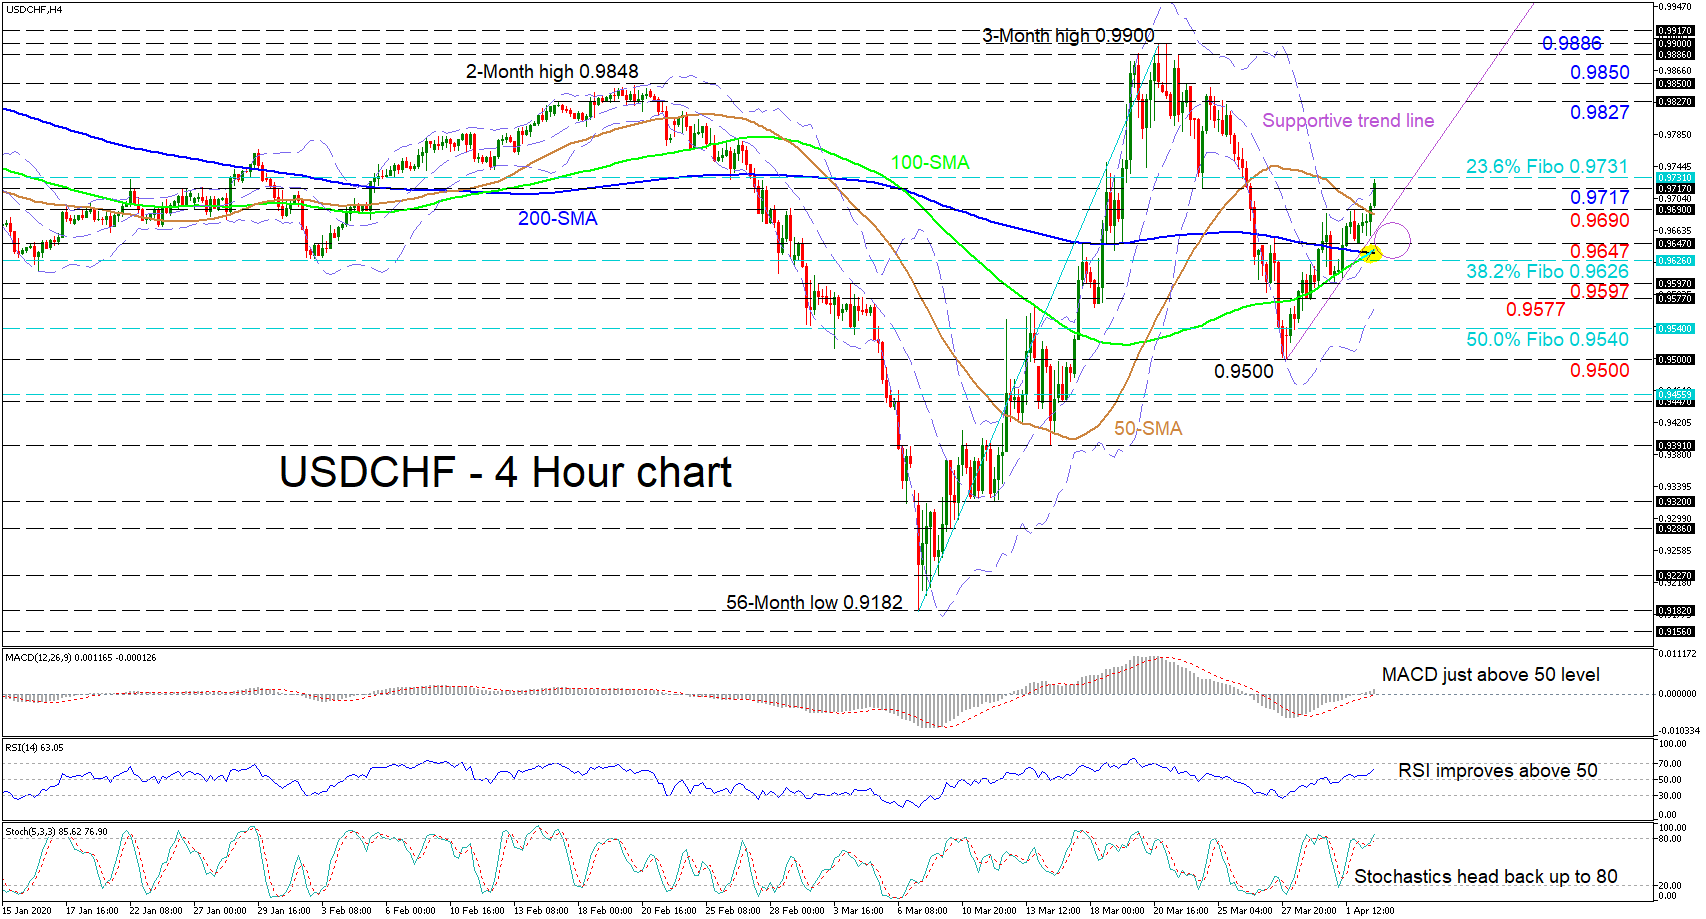
USDCHF appears to be breaking above the upper Bollinger band and the inside swing low of March 24 at 0.9717, after the climb from the 0.9500 trough was aided by the very short-term supportive trend line just above the 0.9647 low.
The short-term oscillators reflect a pickup in positive momentum as the RSI is improving above its neutral mark and the MACD, above its red trigger line, ascends over the zero level. Moreover, the stochastic oscillator has reclaimed the 80 level and moved into overbought territory. Nevertheless for now, painting an unclear directional picture are the converging simple moving averages (SMAs) on the 4-hour chart.
Ascending and closing above the inside swing low of 0.9717 and the 0.9731 level above – which is the 23.6% Fibonacci retracement of the up leg from 0.9182 to 0.9900 – the pair may rally to challenge the 0.9827 high. Overcoming this, the 0.9850 resistance could impede the price from reaching the 0.9886 top and three-month peak of 0.9900 overhead.
If sellers retake control moving below the 0.9690 level, initial support could come from the 50-period SMA just beneath and the nearby supportive trend line. Breaking below the trend line, an important support region from the 0.9647 low until the 38.2% Fibo of 0.9626 – which includes the 100- and 200-period SMAs and the mid-Bollinger band – could halt the decline towards the 0.9597 trough and the 0.9597 hurdle underneath.
Overall, the near-term picture is positive above the aiding trend line and the 0.9597 low and a break above 0.9731 would reinforce this bias. Whilst in the bigger picture, the pair would need to hold above the 0.9540 and 0.9500 levels to keep the positive outlook intact.


