
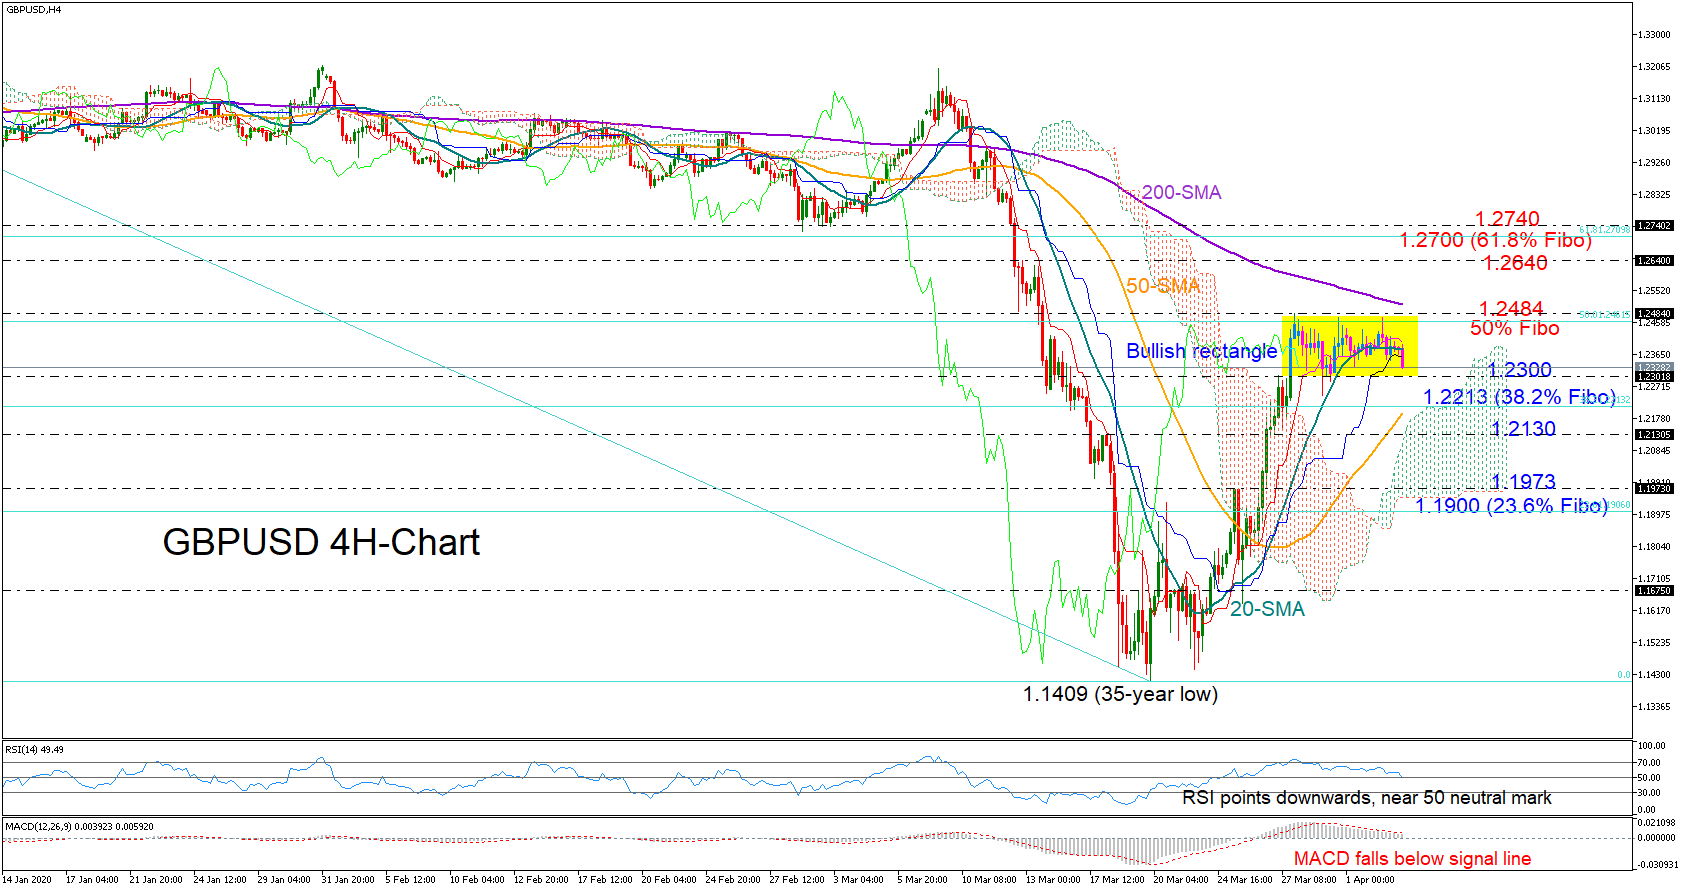
After the rebound off 35-year lows, GBPUSD has been trading quietly this week, congested within a narrow range of 1.2484 and 1.2300, where the former is the 50% Fibonacci of the 1.3513-1.1409 downleg.
Technically, a sideways move following a rally is an indication that the pair is taking a breather before continuing higher. Yet, on the four-hour chart, the falling RSI which heads towards its 50 neutral mark backed by the declining MACD and the flattening red Tenkan-sen are currently not in favor of an upside break.
Nevertheless, should the price climb above the 1.2484 ceiling and particularly close above the 200-period simple moving average (SMA) at 1.2192, expectations are for further improvement towards the 1.2640 resistance and then up to the 1.2740 level which is slightly above the 61.8% Fibonacci.
Otherwise, should the pair weaken below the 1.2300 bottom, the 38.2% Fibonacci of 1.2213 and the 50-period SMA could come to the rescue. If not, with the price retreating below 1.2130 too, the way would open towards the 1.1973-1.1900 restrictive region.
In short, GBPUSD is hovering within a rectangle that flags the continuation of the upside direction, though the discouraging signals from the momentum indicators suggest that the bullish formation should be treated carefully.


