
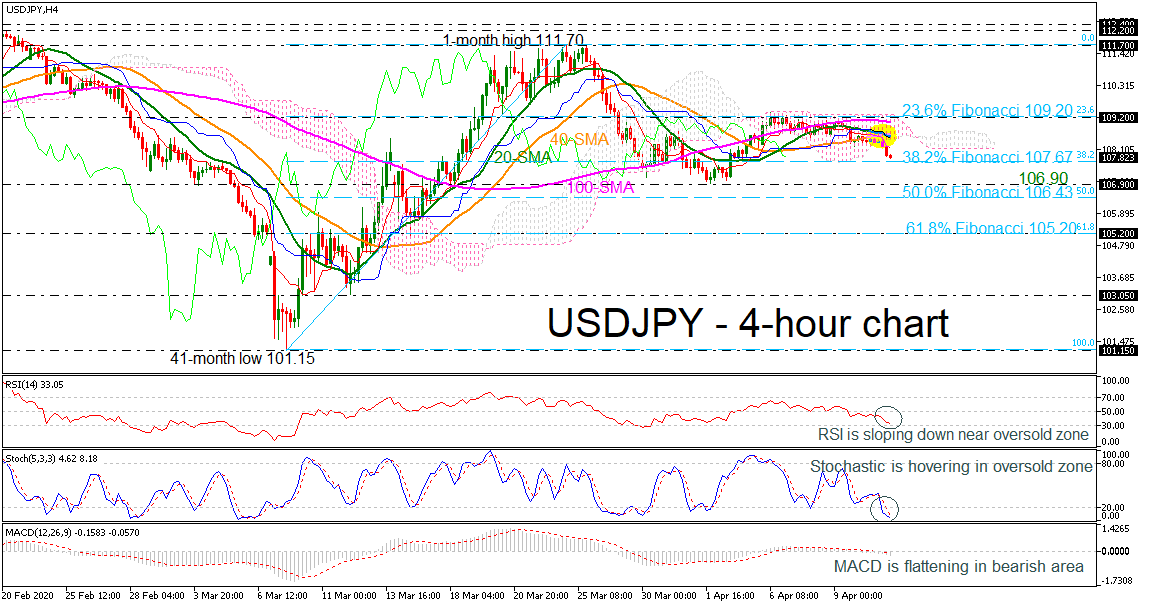
USDJPY is extending a downside move in the 4-hour chart, after a sidelines trend over the last days and it has dropped beneath the bearish cross within the 20- and 40-period simple moving averages (SMAs). Also, the price declined below the Ichimoku cloud, which is currently acting as strong resistance for the bulls.
The technical indicators are indicating a bearish mode as the RSI is approaching the oversold zone and the stochastics are continuing their dive momentum below the 20 level. However, the MACD oscillator is flattening below the zero line, suggesting that the market is still in a narrow range in the near term.
In case of more selling interest, immediate support is coming from the 38.2% Fibonacci retracement level of the up leg from 101.15 to 111.70 at 107.67, before slipping towards the 106.90 barrier. If the pair penetrates this level, traders could look at the 50.0% Fibonacci of 106.43 and the 105.20 support, which is overlapping with the 61.8% Fibonacci.
In the upside scenario, a jump above the SMAs could hit the upper surface of the Ichimoku cloud which is near with the 23.6% Fibonacci and the 109.20 resistance. Even higher, the next stop could come from the 111.70 resistance, taken from the peak on March 24.
Summarizing, USDJPY is trying to exit lower from the sideways move in the very short-term timeframe, while in the bigger picture, it has been in a bearish correction tone over the last three weeks.


