
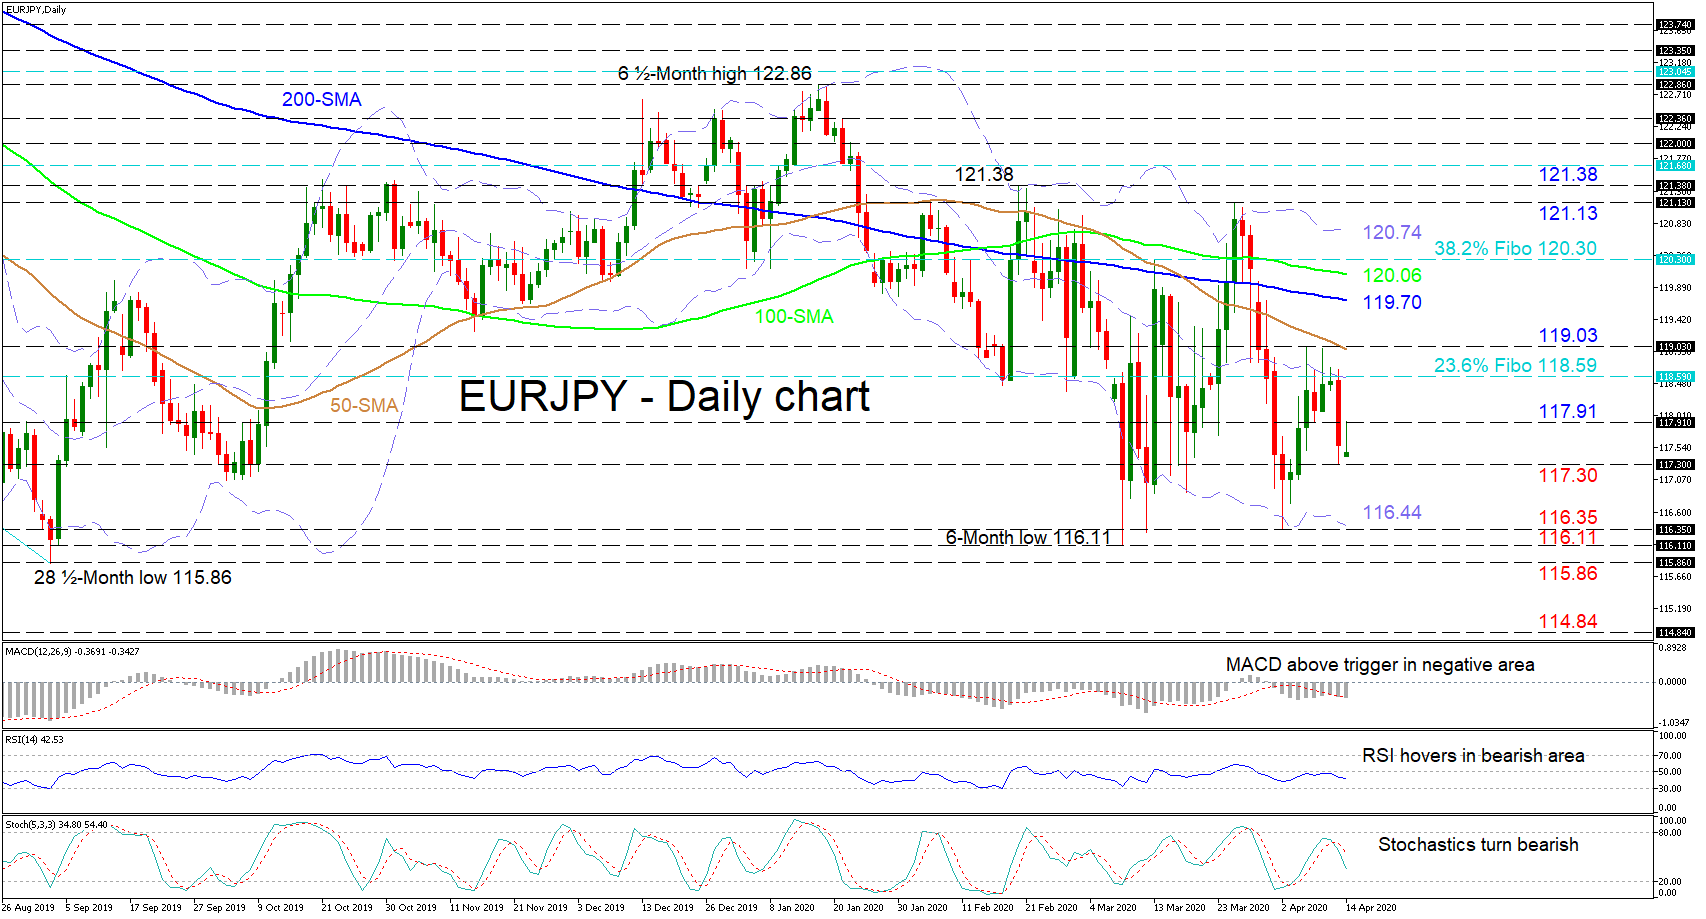
EURJPY sellers seem to have resurfaced after the pair reversed down from the capping mid-Bollinger band. That said, the pair remains confined within a horizontal market of 122.86 – 116.11, as the clash between buyers and sellers continues to zigzag the price between these boundaries.
Directional signals are also unclear as illustrated in the short-term oscillators. The MACD, in the negative region, has moved just above its red trigger line, while the RSI, hovers in the bearish zone, slipping slightly below its neutral mark. The stochastics on the other hand have turned bearish, while more conflicting signals are viewed within the simple moving averages (SMAs) as the 100- and 200-day SMAs flatten, and the 50-day SMA drops.
If sellers steer below the 117.30 border, the price may drop to encounter the lower Bollinger band of 116.44 and the supports of 116.35 and 116.11 beneath. Breaking under the six-month bottom of 116.11, the 115.86 barrier from September 3 could prevent the pair from declining towards the 114.84 trough from April of 2017.
Pushing above the 117.91 immediate hurdle, a first tough resistance lies at the 118.59 mark, which is the 23.6% Fibonacci retracement of the down leg from 127.49 to 115.86 and where the mid-Bollinger band also resides. Next, conquering the latest high of 119.03 – coupled with the 50-day SMA – could send the price towards the 200- and 100-day SMAs at 119.70 and 120.06 respectively. A sustained climb over the 38.2% Fibo of 120.30 could test the upper Bollinger band at 120.74 and the tops of 121.13 and 121.38.
Overall, a neutral picture persists in the short- and medium-term timeframes with breaks above 122.86 or below 116.11 being able to shift the outlook.


