
The EUR/USD currency pair
Technical indicators of the currency pair:
Prev Open: 1.09390
Open: 1.09084
% chg. over the last day: -0.16
Day’s range: 1.09016 – 1.09487
52 wk range: 1.0777 – 1.1494
The EUR/USD currency pair has become stable. At the moment, the technical pattern is ambiguous. Financial markets participants expect additional drivers. The local support and resistance levels are 1.0915 and 1.0965, respectively. We do not exclude further growth of the single currency. Positions should be opened from key support and resistance levels.
Chinese exports and imports slowed down the decline in March after falling earlier this year. At the same time, most experts agree that a confident recovery in trade is not expected in the near future.
The Economic News Feed for 14.04.2020
Today, the publication of important economic releases is not planned.
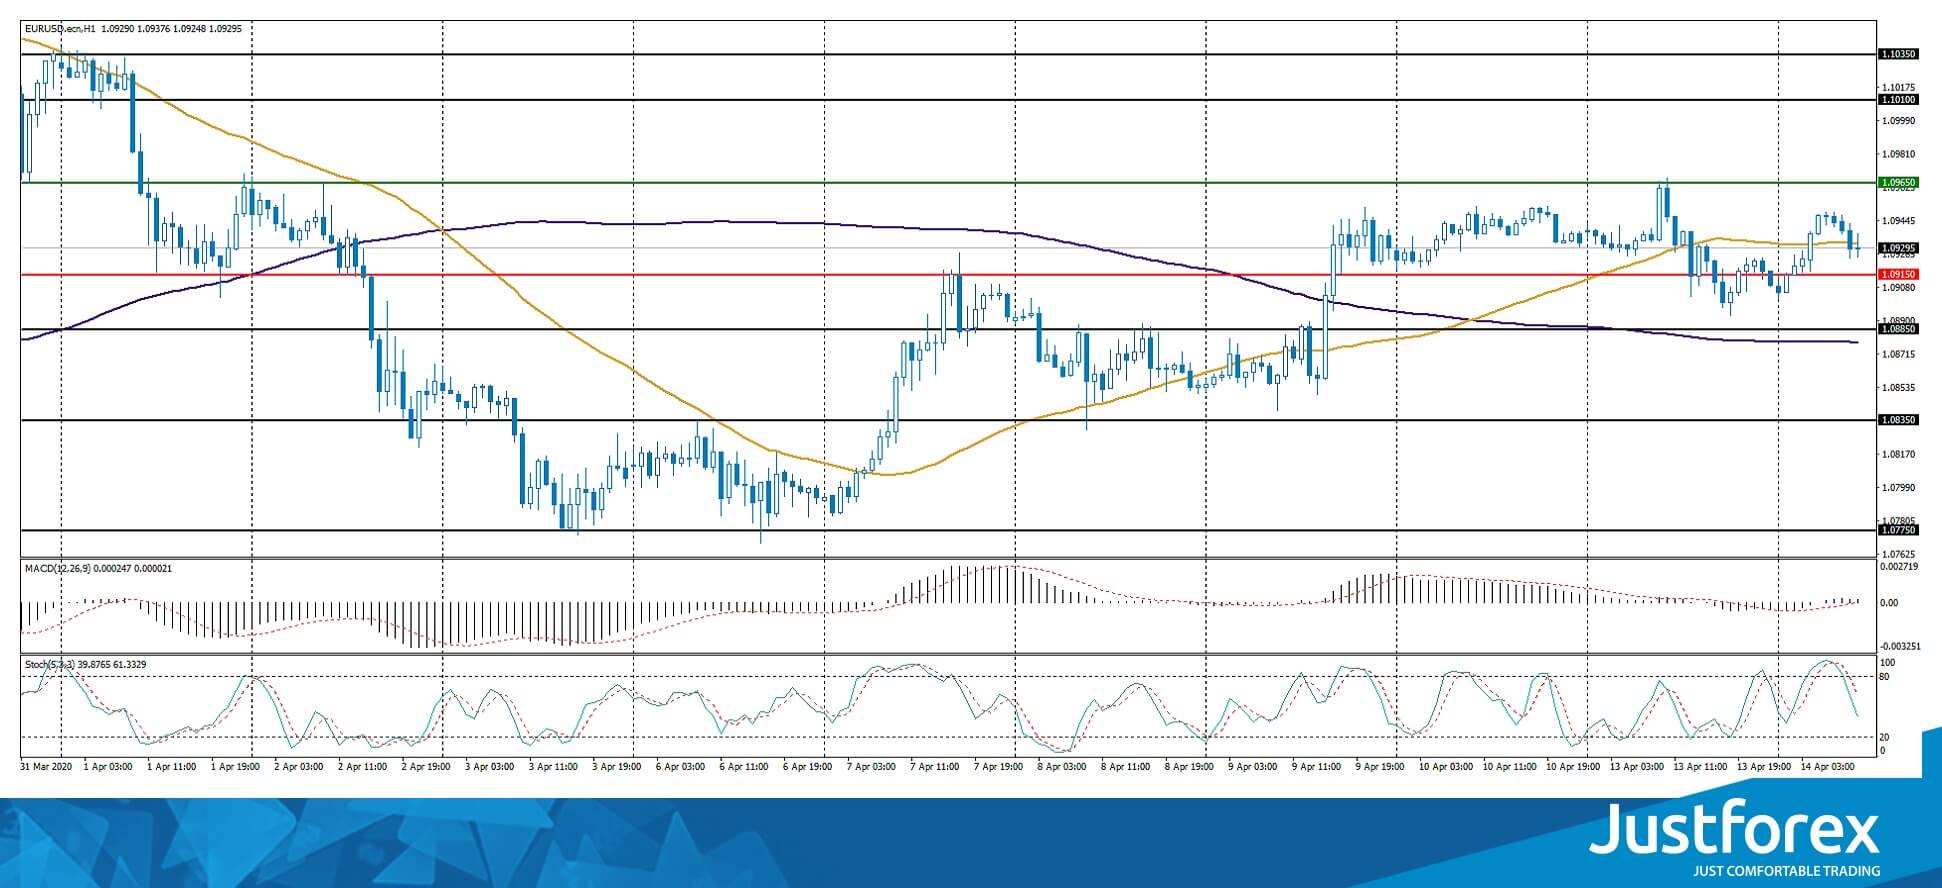
Indicators do not give accurate signals: the price has crossed 50 MA.
The MACD histogram is near the 0 mark.
Stochastic Oscillator is in the neutral zone, the %K line is below the %D line, which indicates the bearish sentiment.
Trading recommendations
Support levels: 1.0915, 1.0885, 1.0835
Resistance levels: 1.0965, 1.1010, 1.1035
If the price fixes above 1.0965, further growth of the EUR/USD currency pair is expected. The movement is tending to 1.1000-1.1020.
An alternative could be a drop in the EUR/USD quotes to 1.0885-1.0860.
The GBP/USD currency pair
Technical indicators of the currency pair:
Prev Open: 1.24583
Open: 1.24975
% chg. over the last day: +0.42
Day’s range: 1.24971 – 1.25739
52 wk range: 1.1466 – 1.3516
GBP/USD quotes show a steady uptrend. The trading instrument has updated local highs again. The British pound found resistance at 1.2570. The round level of 1.2500 is already a “mirror” support. We do not exclude further growth of the GBP/USD currency pair. We recommend following the latest information regarding the COVID-19 spread. Positions should be opened from key levels.
The news feed on the UK economy is calm.
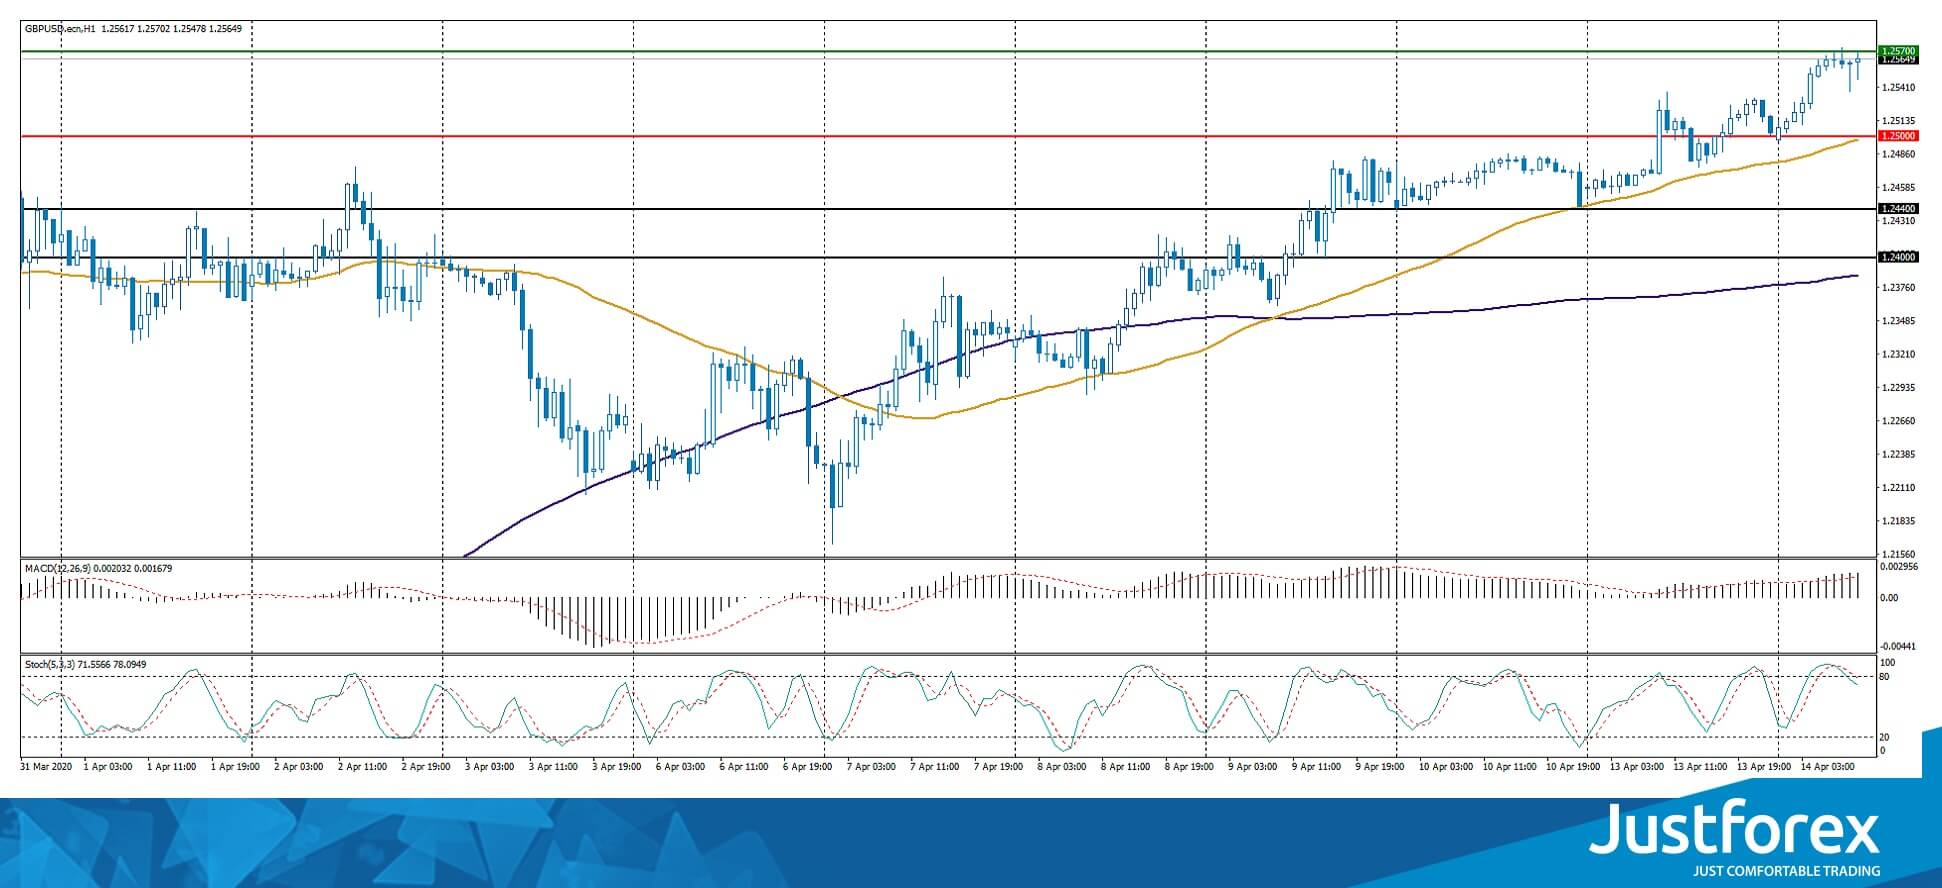
Indicators signal the power of buyers: the price has fixed above 50 MA and 100 MA.
The MACD histogram is in the positive zone, indicating the bullish sentiment.
Stochastic Oscillator has started to exit the overbought zone, the %K line is below the %D line, which indicates a possible correction of the GBP/USD currency pair.
Trading recommendations
Support levels: 1.2500, 1.2440, 1.2400
Resistance levels: 1.2570, 1.2650
If the price fixes above 1.2570, further growth of GBP/USD quotes is expected. The movement is tending to 1.2620-1.2650.
An alternative could be a decrease in the GBP/USD currency pair to 1.2470-1.2440.
The USD/CAD currency pair
Technical indicators of the currency pair:
Prev Open: 1.39236
Open: 1.38912
% chg. over the last day: -0.47
Day’s range: 1.38627 – 1.39060
52 wk range: 1.2949 – 1.4668
The USD/CAD currency pair has been declining. The trading instrument has updated local lows. The loonie is currently consolidating near the support level of 1.3855. The 1.3925 mark is already a “mirror” resistance. The Canadian dollar has the potential for further growth against the greenback. We recommend paying attention to the dynamics of oil quotes. Positions should be opened from key levels.
The news feed on Canada’s economy is calm.
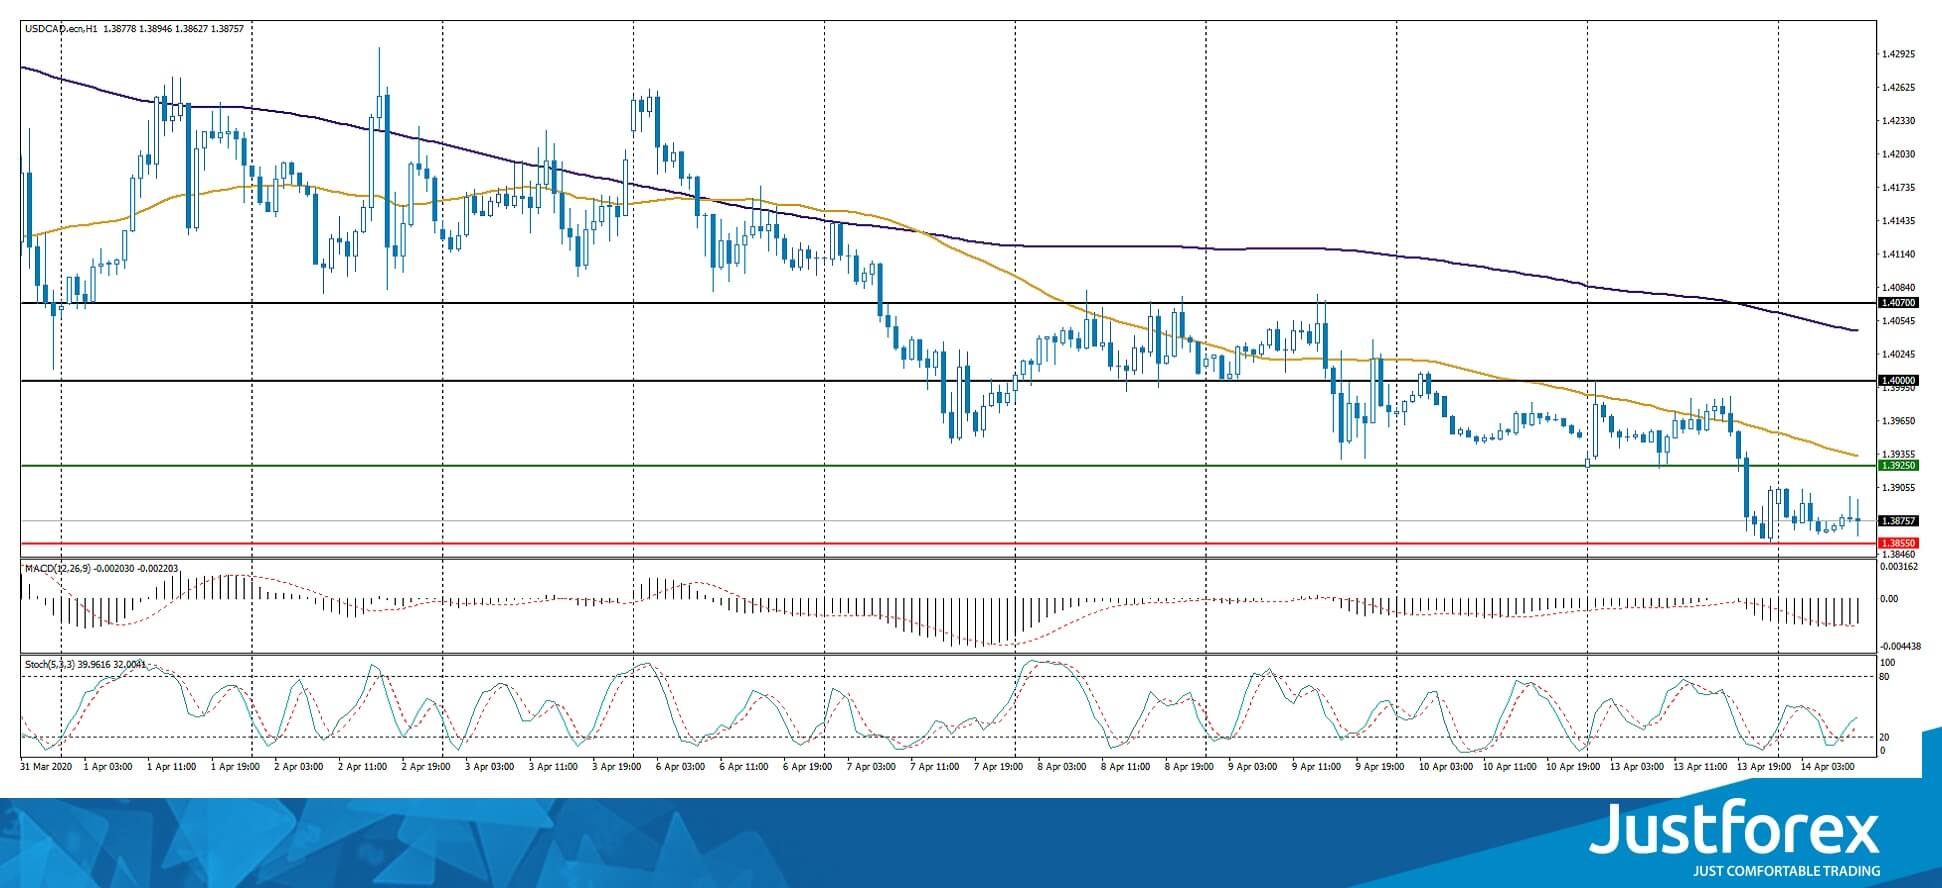
Indicators signal the power of sellers: the price has fixed below 50 MA and 100 MA.
The MACD histogram is in the negative zone, indicating the bearish sentiment.
Stochastic Oscillator is in the neutral zone, the %K line is above the %D line, which gives a signal to buy USD/CAD.
Trading recommendations
Support levels: 1.3855, 1.3800
Resistance levels: 1.3925, 1.4000, 1.4070
If the price fixes below 1.3855, a further drop in the USD/CAD quotes is expected. The movement is tending to the round level of 1.3800.
An alternative could be the growth of the USD/CAD currency pair to 1.3960-1.4000.
The USD/JPY currency pair
Technical indicators of the currency pair:
Prev Open: 108.388
Open: 107.745
% chg. over the last day: -0.52
Day’s range: 107.536 – 107.756
52 wk range: 101.19 – 112.41
The USD/JPY currency pair continues to show a negative trend. The trading instrument has updated local lows again. At the moment, USD/JPY quotes are consolidating in the range of 107.50-107.85. Demand for the “safe haven” currencies is still high. The yen has the potential for further growth against the greenback. We recommend paying attention to the dynamics of US government bonds yield. Positions should be opened from key levels.
The news feed on Japan’s economy is calm.
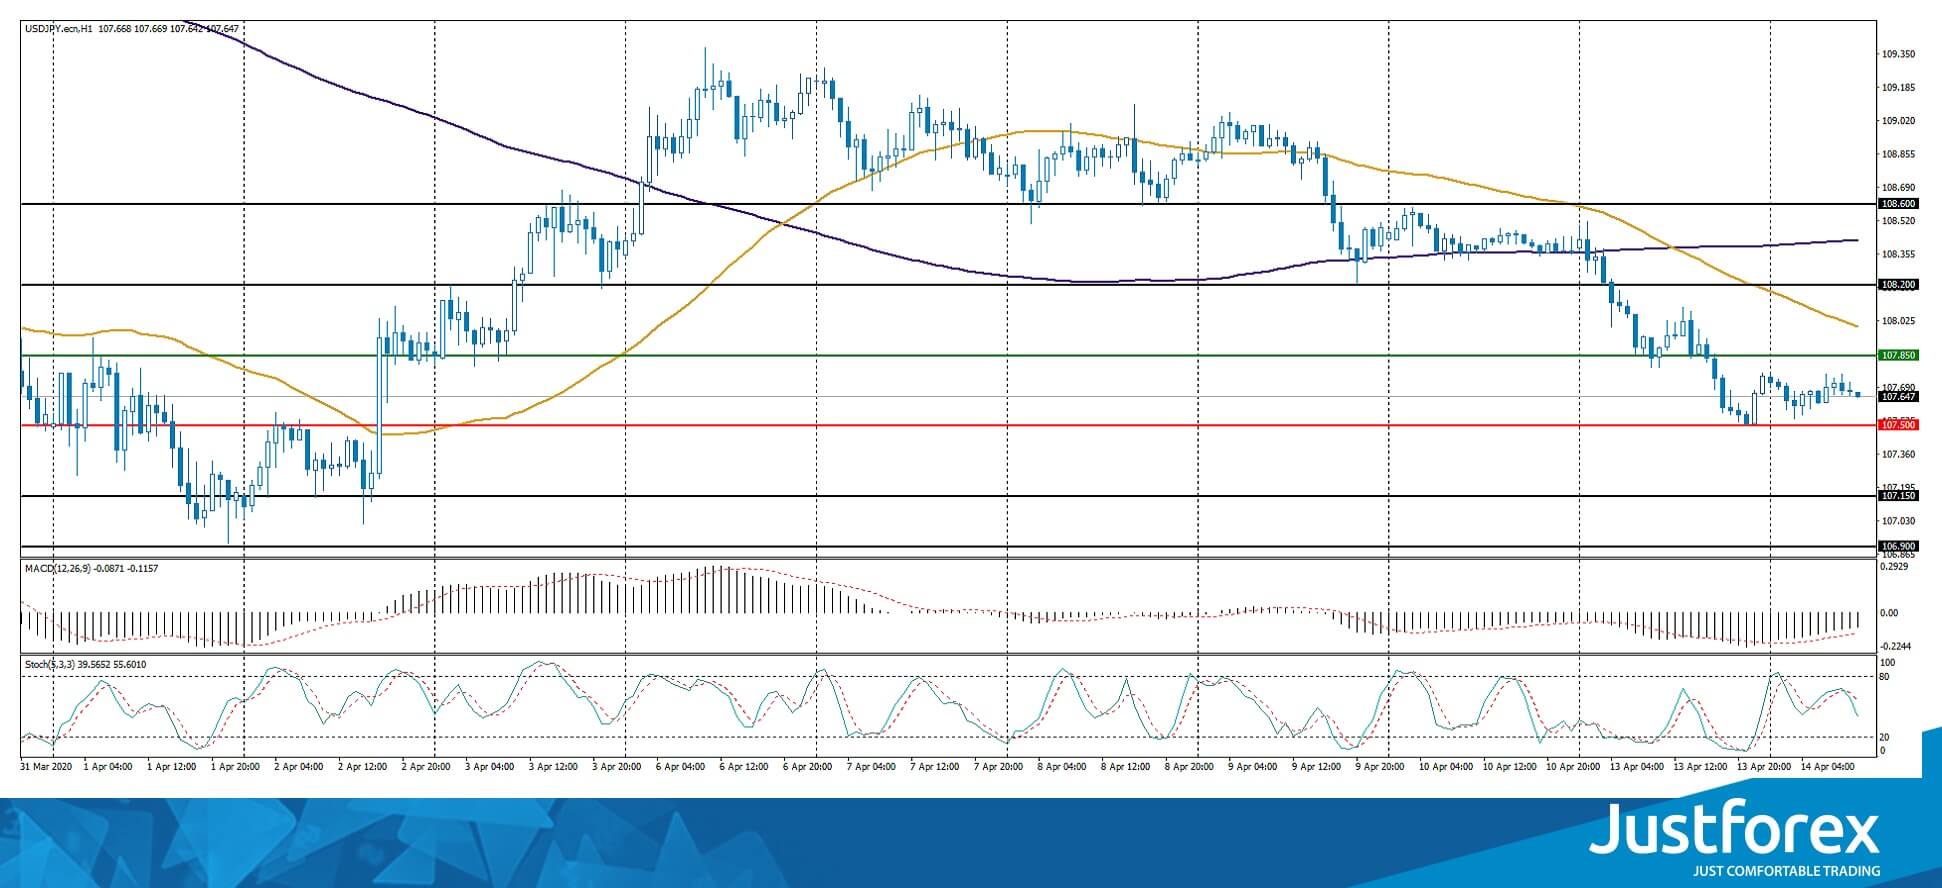
Indicators signal the power of sellers: the price has fixed below 50 MA and 100 MA.
The MACD histogram is in the negative zone, indicating the bearish sentiment.
Stochastic Oscillator is in the neutral zone, the %K line is below the %D line, which also gives a signal to sell USD/JPY.
Trading recommendations
Support levels: 107.50, 107.15, 106.90
Resistance levels: 107.85, 108.20, 108.60
If the price fixes below 107.50, a further drop in the USD/JPY quotes is expected. The movement is tending to the round level of 107.00.
An alternative could be the growth of the USD/JPY currency pair to 108.10-108.30.


