
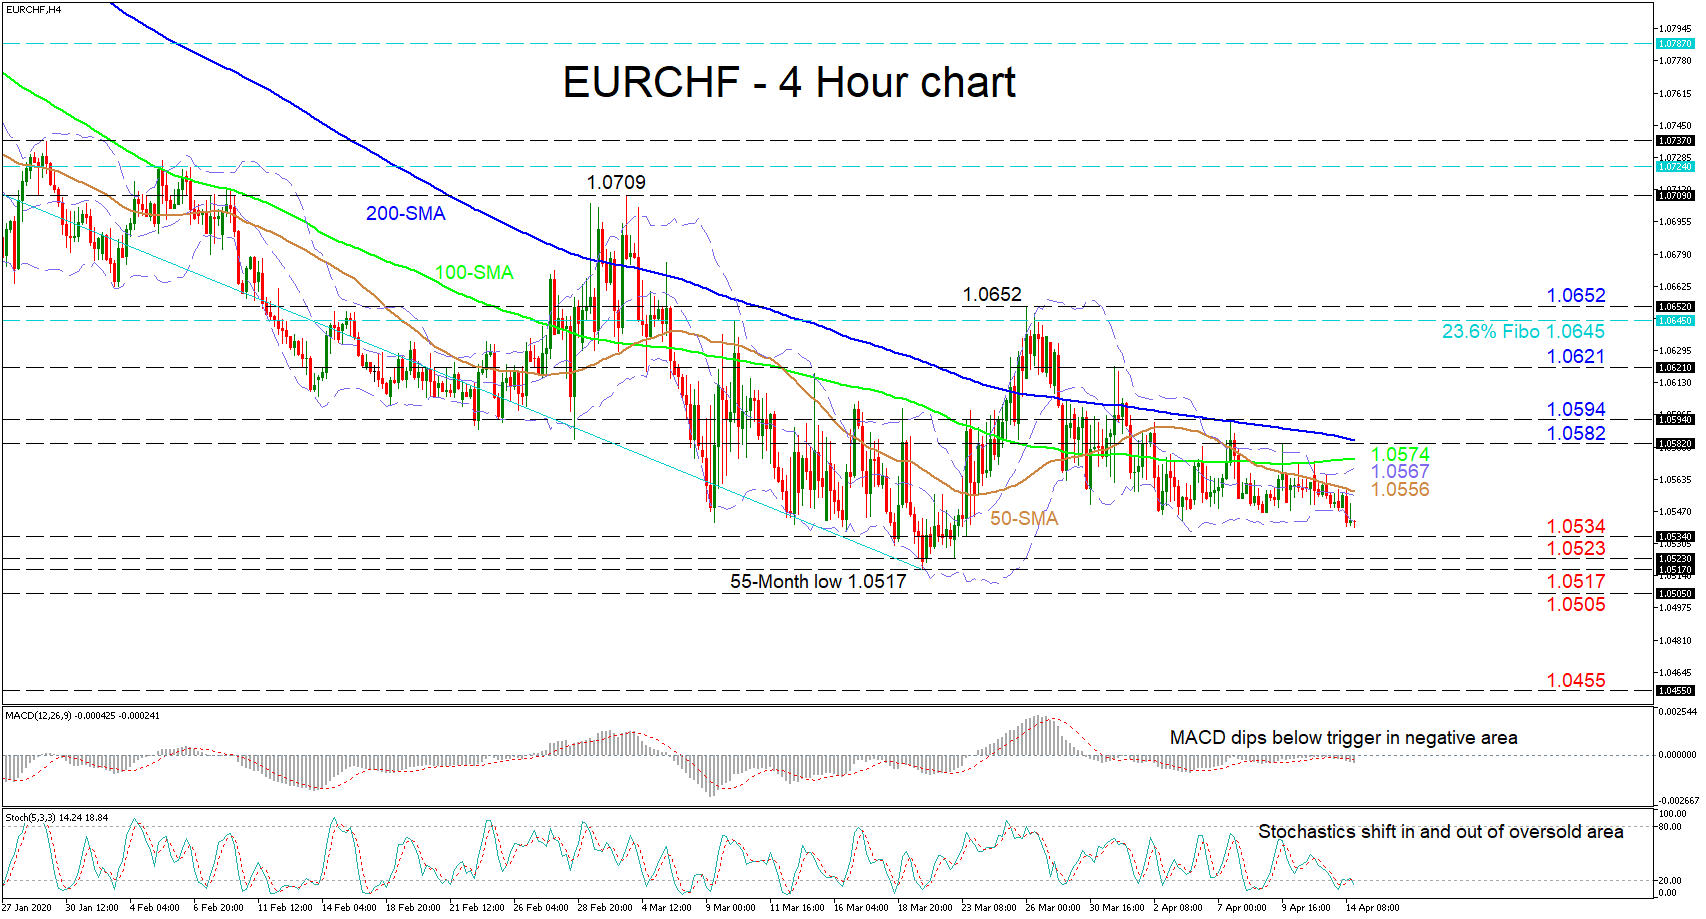
EURCHF’s long-term downtrend has glided the pair towards a 55-month low of 1.0517 and into a neutral market since the beginning of March. The price is continuing to creep sideways, being squeezed by the Bollinger bands, which are reflecting the weak direction in price action.
The short-term oscillators reflect conflicting signals, with the MACD marginally in the negative territory and below its red trigger line, indicating a desire to increase negative momentum. Moreover, the stochastic %K and %D lines are moving in and out of the oversold region. Adding to this indecisiveness are the multiple overlaps within the 50- and 100-period simple moving averages (SMAs) under the prevailing negative sloping 200-period SMA.
If sellers extend under the lower Bollinger band, immediate support could rest at the 1.0534 level ahead of the 1.0523 low, before a revisit to the multi-year bottom of 1.0517. Determined bears could then steer the price beneath this significant bottom to the 1.0505 obstacle before plunging towards the 1.0455 barrier from back in July of 2015.
Alternatively, the mid-Bollinger band coupled with the 50-period SMA around 1.0556 could be the first border to limit upside corrections. Overcoming the next constrictions from the upper Bollinger band of 1.0567 and the 100-period SMA at 1.0574, the nearby high of 1.0582 – fortified by the 200-period SMA – could halt the climb for the 1.0594 resistance and 1.0621 swing high. Stretching higher, the 1.0645 level, which is the 23.6% Fibonacci retracement of the down leg from 1.1058 to 1.0517, and the nearby 1.0652 peak could draw traders’ attention.
Overall, the short-term bias continues to lack direction and a close above 1.0652 or below 1.0517 could boost the next direction.


