
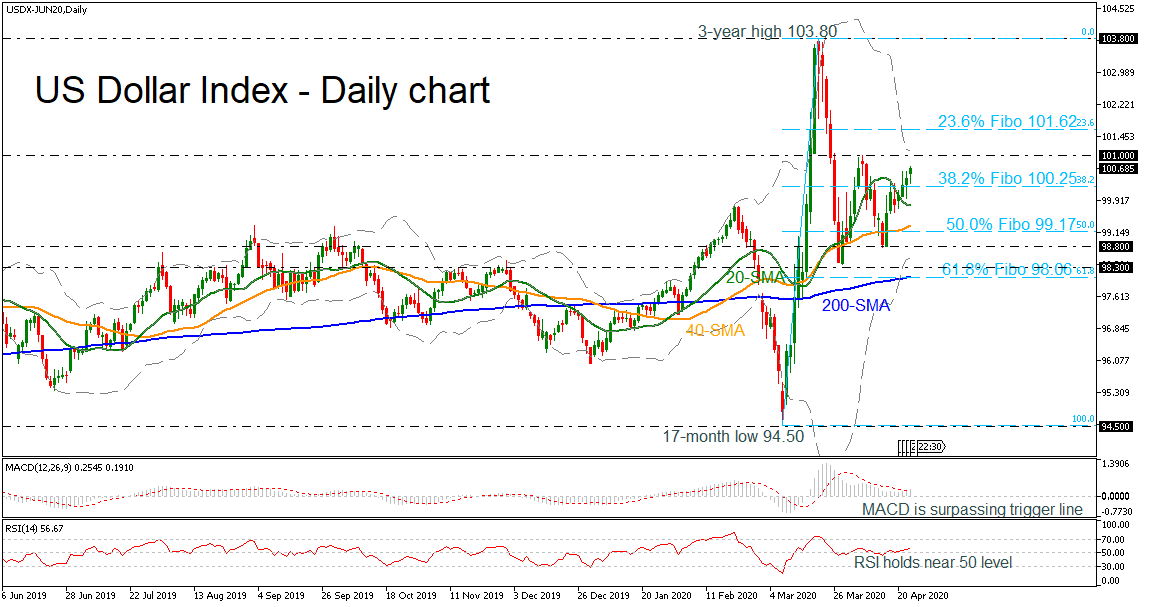
The US dollar index continues to rise above the short-term simple moving averages (SMAs) following the bounce off the 98.30 support level. According to the MACD, positive momentum could push for further gains in the near-term as the indicator picks up steam above its trigger line. The RSI is also marginally advancing above the neutral threshold of 50.
In the positive scenario, where the price continues to expand, a new top could be formed around the 101.00 barrier, where the upper Bollinger band is currently located. If the market manages to overcome that area, traders could look for resistance at the 23.6% Fibonacci retracement level of the up leg from 94.50 to 103.80 at 101.62 before jumping sharply higher towards the three-year high of 103.80.
A reversal to the downside could stall at the 38.2% Fibonacci mark of 100.25. Further below, the 20-day SMA at 99.80 could also provide support and any violation at this point could potentially trigger further sell-off in the market, probably leading the price down to the 40-day SMA, which currently stands slightly above the 50.0% Fibo of 99.17. Even lower, the 98.80 and 98.30 levels could come next ahead of the 200-day SMA, which overlaps with the 61.8% Fibo.
Regarding the medium-term picture, the bullish structure has been steadily building up and the index would enter into bullish territory if it overcomes the 101.00 level.


