
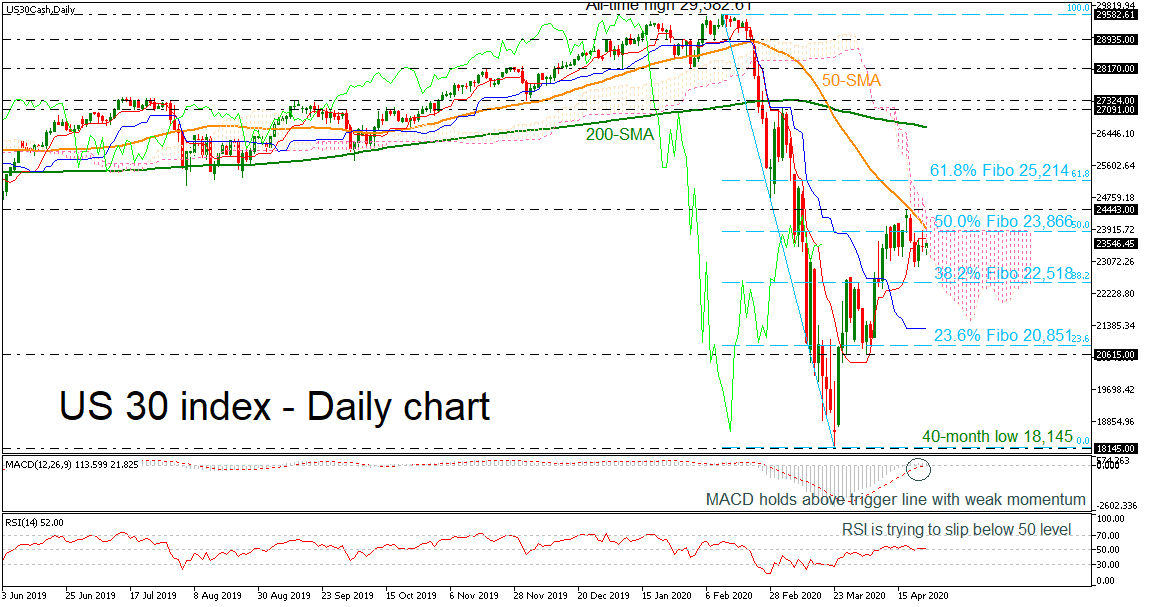
The US 30 stock index (cash) found strong resistance at the 24,443 level and the 50-day simple moving average (SMA), returning back below the 50.0% Fibonacci retracement level of the downward wave from 29,582.61 to 18,145 at 23,866.
Technically, the RSI indicator, holding in positive territory, is moving sideways with weak momentum, while the MACD is standing above the trigger and zero lines but is failing to suggest any directional movement.
Further declines may meet support around the 38.2% Fibonacci of 22,518 and the base of the Ichimoku cloud. Even lower, the 23.6% Fibonacci of 20,851 and the 20,615 support would be eyed before challenging the 40-month trough of 17,160-17,490.
On the upside, if there is a step above the 50.0% Fibonacci and the 50-day SMA, resistance could be found at the 24,443 barrier. More gains could lead the index towards the 61.8% Fibonacci of 25,214 before sending the market until the 200-day SMA currently at 26,626. Such a move could be the first sign for a possible bullish tendency again.
Summarizing, the US 30 index has been developing in an upside correction mode since it paused its negative rally at 18,145. A break of the 200-day SMA could switch the long-term outlook to bullish again.


 to Pullback in Wave 4")


