
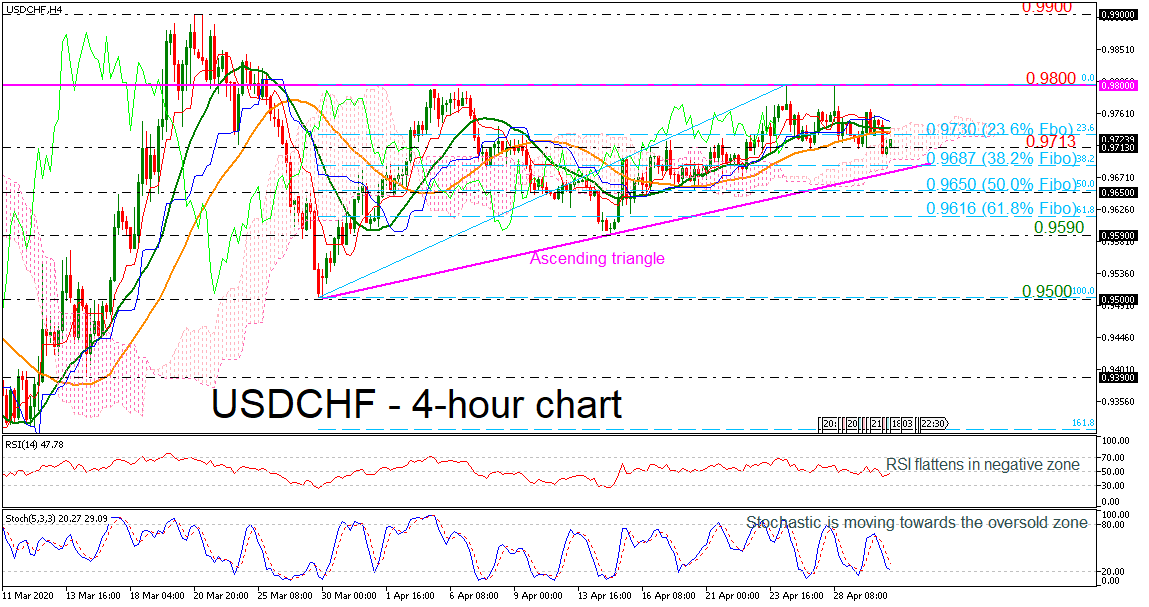
USDCHF had a bearish start on Thursday, dropping beneath the 23.6% Fibonacci retracement level of the upward wave from 0.9500 to 0.9800, at 0.9730, and the 20- and 40-period simple moving averages (SMAs). The pair has been in process to create an ascending triangle pattern over the last month with strong upper boundary the 0.9800 round number.
In momentum indicators, the RSI slipped back to the bearish zone, but it is currently flat. Also, the stochastic oscillator is heading towards the oversold zone and the red Tenkan-sen line is moving below the blue Kijun-sen line, suggesting more losses in the short-term.
If the decline continues, the price could retest the 38.2% Fibo of 0.9687 and the lower surface of the Ichimoku cloud. Below that, the pair could penetrate the rising trend line to touch the 50.0% Fibo of 0.965, while lower the market could see more weakness until the 61.8% Fibo of 0.9616.
In the positive scenario, a successful jump above the 23.6% Fibo of 0.9730 and the SMAs could strengthen the price until the 0.9800 mark. If bulls keep the upper hand, the door could open for the psychological level of 0.9900, registered on March 20.
Summarizing, USDCHF is holding a neutral bias, with immediate support likely coming around 0.9687. A rally above 0.9800 is expected to shift the risk back to positive.


