
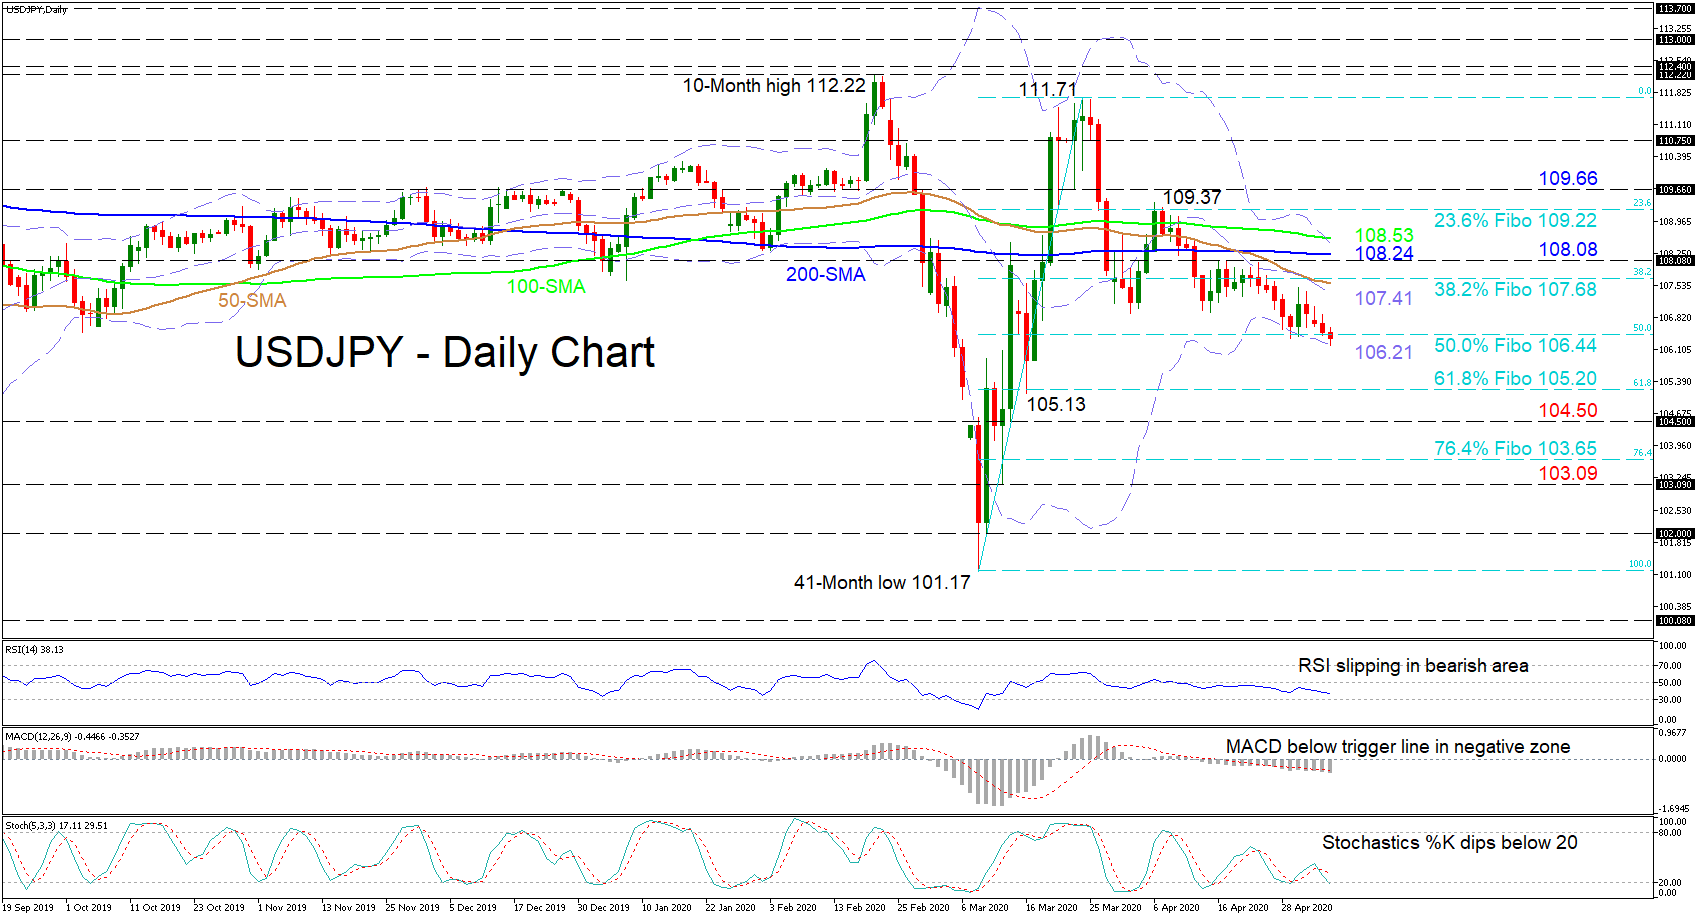
USDJPY appears to be losing footing at the 106.44 level, that being the 50.0% Fibonacci retracement of the up leg from the 41-month low of 101.17 to the 111.71 high, tracing the lower Bollinger band around 106.21.
The current negative push is confirmed by the downward slope in the 50-day simple moving average (SMA) as well as the increase in negative momentum reflected in the technical oscillators. The MACD, in the negative zone, is decreasing below its red trigger line, while the RSI glides lower in the bearish region towards the 30 level. Furthermore, the stochastics have begun to develop a negative mode with the blue %K line piercing below the 20 mark and the red %D line turning down.
To the downside, instant support could come from the lower Bollinger band around 106.21. If selling interest picks up, the pair could descend to meet the 61.8% Fibo of 105.20, near a key swing low of 105.13 from March 16. Steering further down, the 104.50 barrier may draw focus ahead of the 76.4% Fibo of 103.65, before the 103.09 trough tempts bears.
Should buyers push over the 50.0% Fibo of 106.44, initial resistance could surface from the mid-Bollinger band of 107.41 until the 38.2% Fibo of 107.68, encompassing the 50-day SMA as well. If these obstacles are surpassed, additional limitations to upside corrections could arise from the 200-day SMA of 108.24 and the nearby 100-day SMA at 108.53, coupled with the upper Bollinger band. Steering above, the climb may be challenged by the 23.6% Fibo of 109.22 and the 109.66 inside swing low of March 23.
Summarizing, the pair appears to be enticed towards lower levels in the very short-term timeframe and only a shift above 109.37 could put the neutral-to-bearish picture at bay.


