
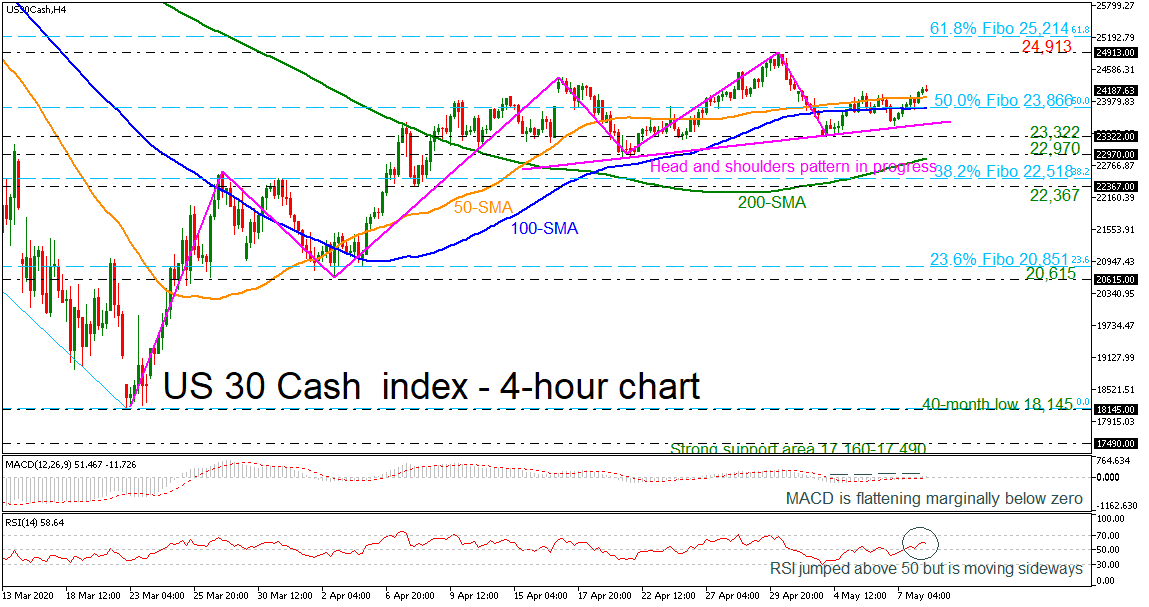
The US 30 Cash index appears to be forming a head and shoulders pattern in the 4-hour timeframe in a possible signal for a negative trend reversal. In the previous downfall, the price failed to slip below its previous low of 23,322 and reversed north again, surpassing the flat 50- and 100-period simple moving averages (SMAs).
That said, the momentum indicators are signaling a flattening mode in the near term. The MACD seems unable to jump above its zero level as it is moving sideways with weak movement, while the RSI, after the jump in the positive region, is failing to improve the bullish picture. Therefore, some caution may remain in the market, with the 200-period SMA pointing upwards.
A continuation of the recent upside moves, well above the formation’s neckline, could indicate the start of an uptrend, with traders increasing buying exposure probably towards the 24,913 resistance level. Slightly higher, there is another obstacle around 25,214, which is the 61.8% Fibonacci retracement level of the down leg from 29,582.61 – an all-time high – to 18,145.
If there is a retreat, all eyes will turn to the 50-period SMA at 24,055 and the 50.0% Fibo, which overlaps with the 100-period SMA at 23,866, where any violation would resume fears of a downward trending market pushing back to the neckline around 23,600. If there is a break below the neckline, the market could shift to negative in the short-term and the price could flirt with the 23,322 – 22,970 support area and the 200-period SMA before meeting the 38.2% Fibo of 22,518.
In short, the uptrend in the US 30 index looks to be at risk as a progressing head and shoulders pattern has appeared in the near term. Traders would wait for a confirmation below the 23,322 level.


