
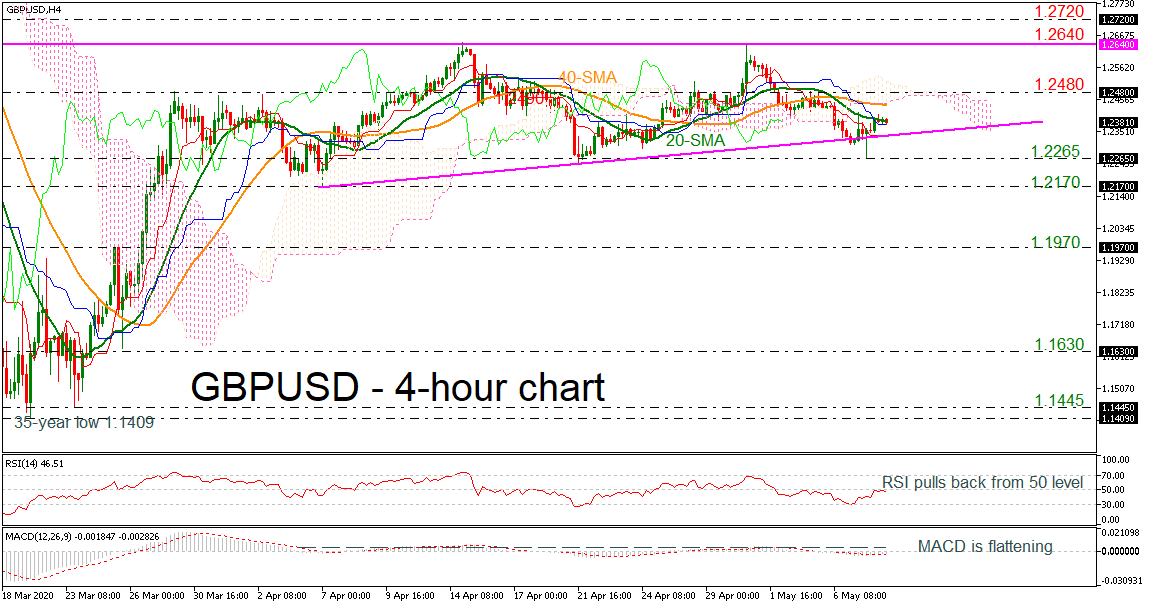
GBPUSD is in the process to creating an ascending triangle pattern with strong resistance the 1.2640 barrier and a rising trend line, which starts from the low on April 7. The pair rebounded on 1.2265 in the preceding sessions and is now flirting with the 20-period simple moving average (SMA) in the 4-hour chart.
Turning to the technical indicators, the RSI has pulled back from the 50 level and returning lower, while the MACD keepS flattening below its zero line in the 4-hour chart.
In case of an upward attempt above the 20-period SMA, the market would re-visit the 40-period SMA and the lower surface of the Ichimoku cloud currently at 1.2444. Above that, the 1.2480 barrier could come in focus ahead of the upper boundary of the triangle at 1.2640. Higher still, a break above this line would send prices to post a new uptrend and challenge the 1.2720 resistance.
On the flip side, if there a penetration to the downside of the formation, the market could head south towards the 1.2265 support and then to the 1.2170 level, registered on April 7. More downside pressures could meet the 1.1970 mark, taken from the inside swing high on March 25.
Concluding, GBPUSD seems to be in a bullish-to-neutral bias in the short-term timeframe and a jump above the ascending triangle would switch the current trend to bullish.


