
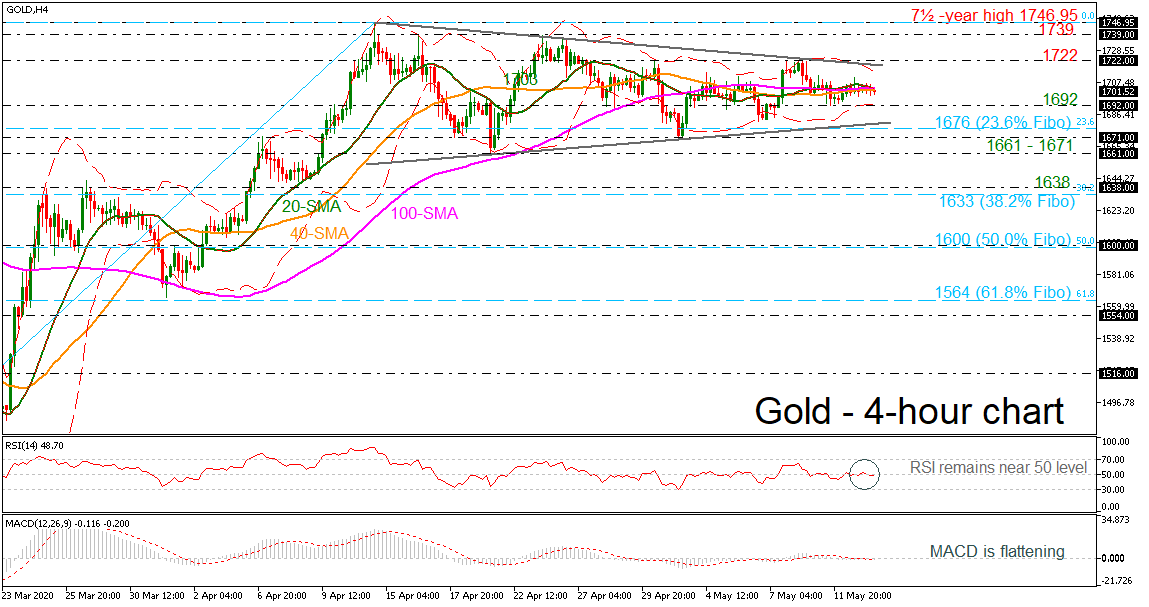
Gold prices are looking more neutral over the last week, hovering around the horizontal simple moving averages (SMAs) on the 4-hour chart. The price has been trading within a symmetrical triangle since April 14 and within the Bollinger bands. The technical indicators are lacking direction too, as the RSI keeps flattening near its neutral threshold of 50, while the MACD continues to move with a very weak momentum around the zero line.
Currently, the pair seems to be facing downside pressure from the 100-period SMA which exposes the metal to the 1,692 support area and the lower Bollinger band. Below that, the ascending line of the triangle, which is marginally above the 23.6% Fibonacci level of 1,676 of the up leg from 1,451 to 1,746.95, could come next into focus. A significant step below this region could open the way for the 1,661 – 1,671 zone.
On the other hand, an increase above all the SMAs could send prices until the 1,722 resistance, which coincides with the falling trendline and the upper Bollinger band. A break above the trianlge could add optimism for more bullish actions towards the 1,739 resistance and the seven-and-a-half year high of 1,746.95.
Summarizing, gold continues to hold a neutral short-term profile within a symmetrical triangle following the bounce off the seven-and-a-half year high of 1,746.95. The precious metal needs to run above the formation and close above the 1,746.95 peak to resume a bullish outlook.


")


