
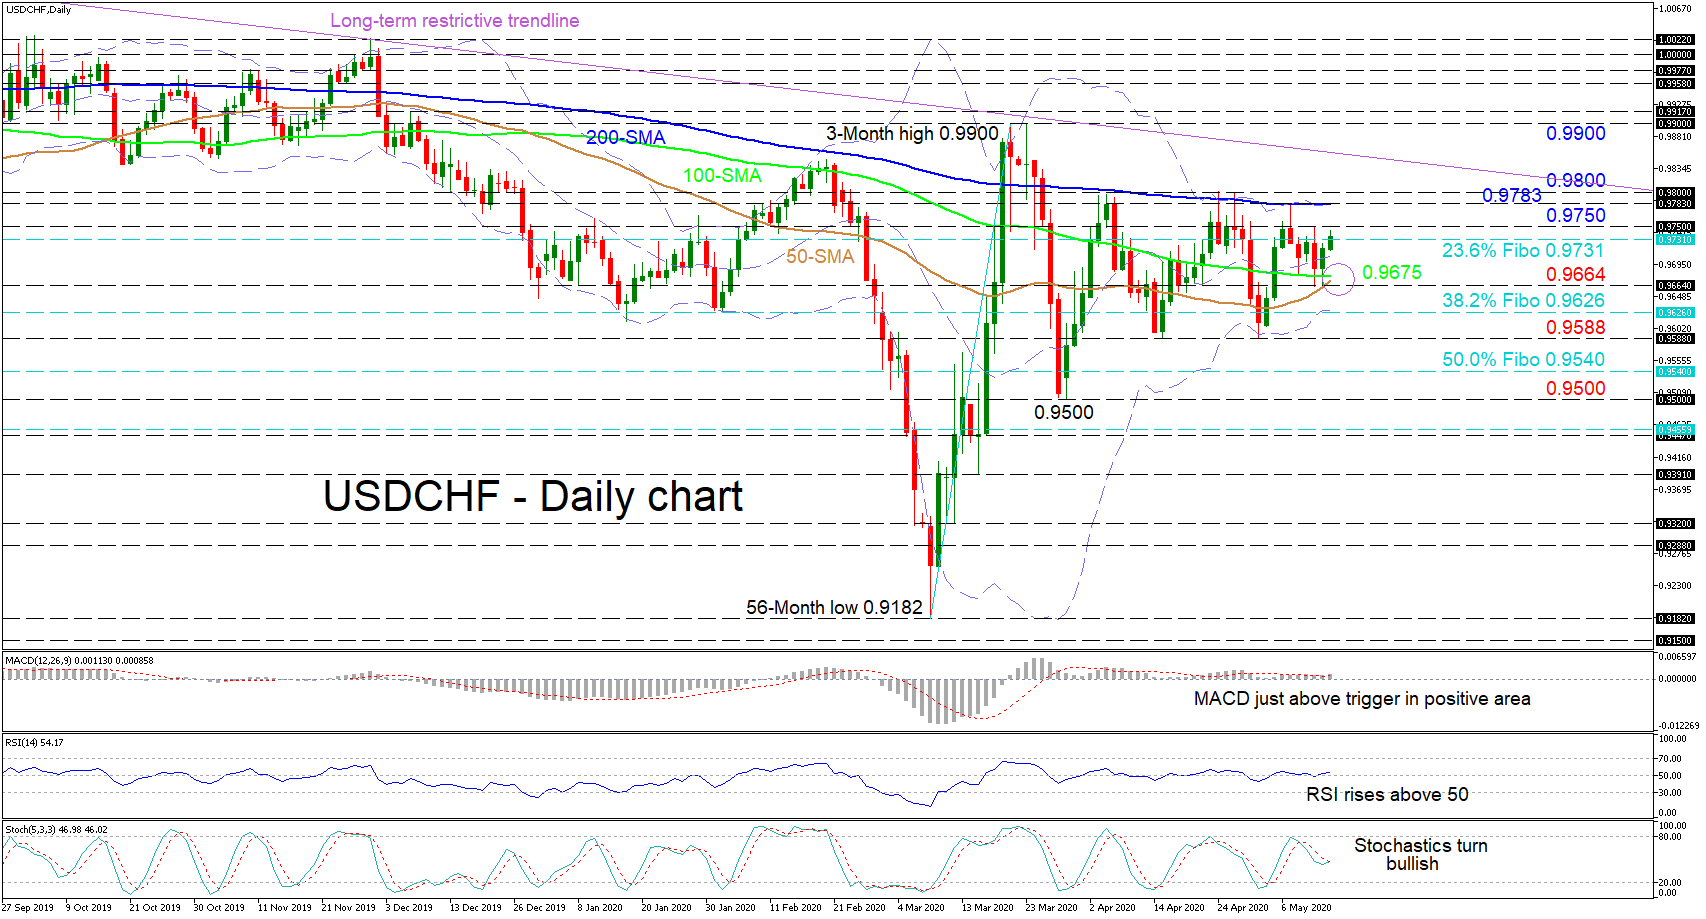
USDCHF appears to have found some footing from the 50-day simple moving average (SMA) and is attempting to climb over the 23.6% Fibonacci retracement of the up leg from the multi-year low of 0.9182 to the three-month peak of 0.9900. Recent price action has improved slightly – something also reflected in the 50-day SMA and within the short-term oscillators.
The MACD, in the positive area, has pierced above its red trigger line, while the RSI is rising from its neutral mark. A quick look at the stochastics, suggests that a bullish crossover could be nearing further fuelling the up move. Moreover, the 50-day SMA is approaching a bullish crossover of the 100-day SMA which could additionally boost advances.
Should sellers retake control and push under the mid-Bollinger band, immediate support could develop from the 100- and 50-day SMAs around 0.9675 and the low of 0.9664. Pushing lower, the price may encounter the 38.2% Fibo at 0.9626 – joined with the lower Bollinger band – prior to challenging the 0.9588 key tough barrier. If this border fails to halt further declines, sustained selling may drop to meet the 50.0% Fibo of 0.9540 ahead of the trough located at 0.9500.
Otherwise, prolonged gains could move over the 23.6% Fibo of 0.9731 and the nearby 0.9750 high to test the flat 200-day SMA and upper Bollinger band, residing at the 0.9783 high, prior to the 0.9783 peak. A stride above may test the long-term descending trend line drawn from 26 April 2019 in efforts to reach the 0.9900 number.
All in all, the near-term picture remains neutral-to-bullish above the 0.9588 base and a move above the long-term falling trend line could strengthen the bullish outlook.


