
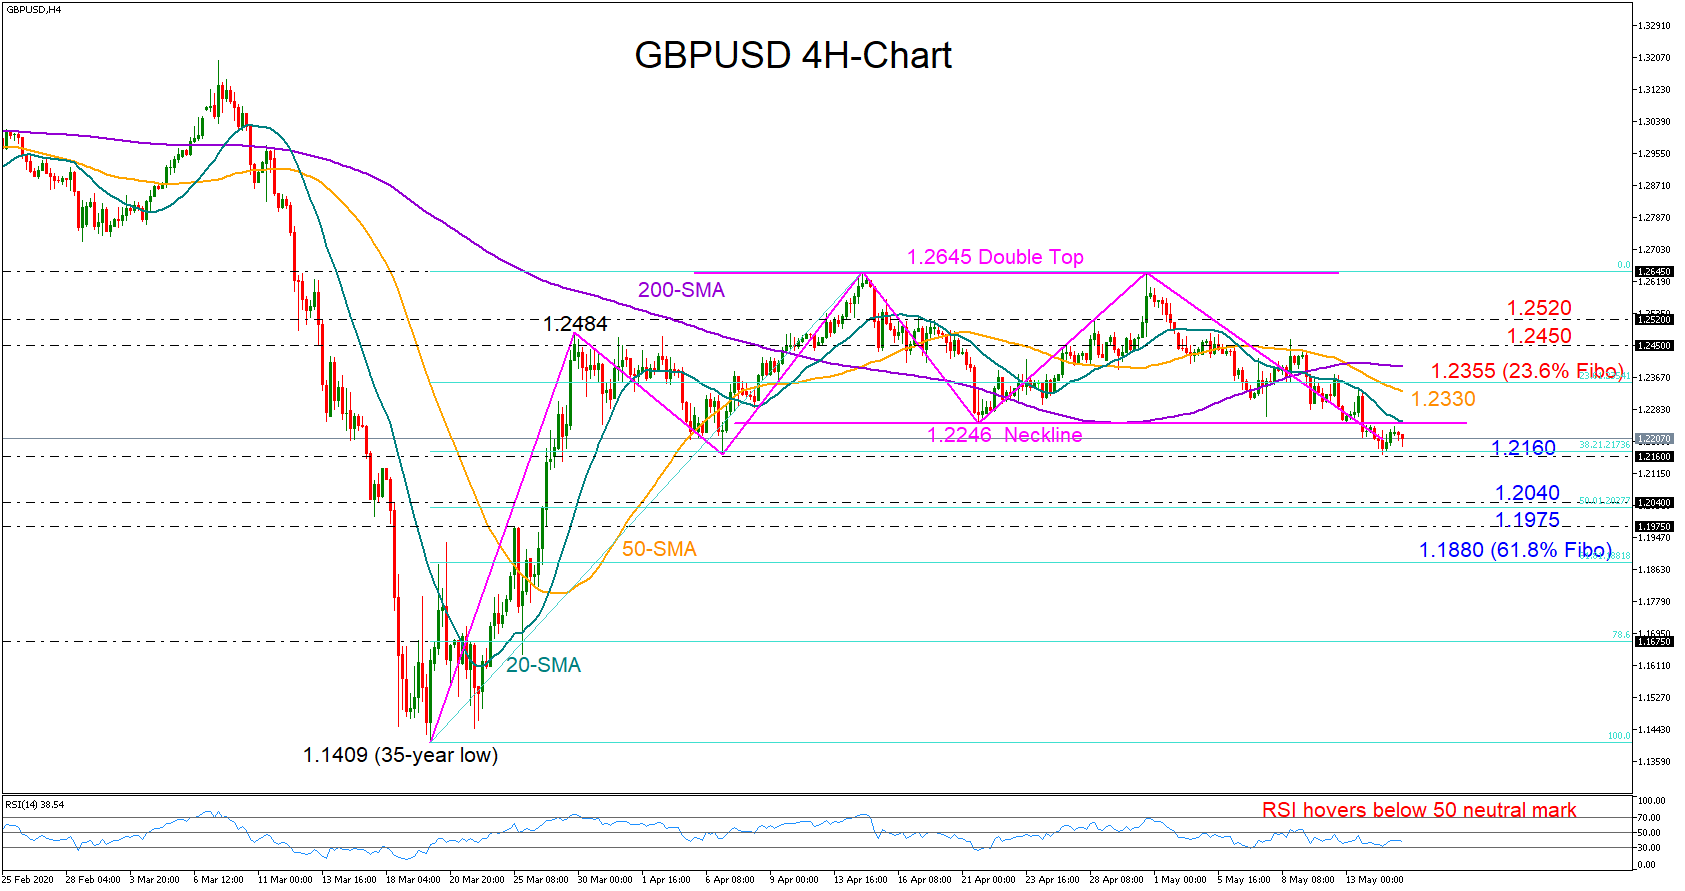
GBPUSD is flashing bearish trend signals on the four-hour chart as the price seems to have completed a double-top pattern below 1.2246.
With the shorter-term simple moving averages (SMAs) also having crossed below the longer-term SMAS, the pair could continue its bearish trajectory, though for that to happen the neckline around 1.2246 and near the 20-period SMA should now act as resistance, while on the downside, the 1.2160 barrier, which is slightly below the 38.2% Fibonacci of the 1.1409-1.2645 upleg, should open the door for more losses.
In this case, support could be next found within the 1.2040-1.1975 territory, which encapsulates the 50% Fibonacci, and ahead of the 61.8% Fibonacci of 1.1880.
Otherwise, a significant reversal above 1.2246 could reduce the credibility of the bearish pattern and hence ease worries of a downward-trending market, pushing resistance up to the 50-period SMA currently around 1.2330. Breaching that obstacle too, the bulls may need to clear the 1.2450-1.2520 region in order to reach again the 1.2645 ceiling, where any violation would switch the outlook back to positive.
Summarizing, GBPUSD is exposed to a bearish trend after breaking the neckline of a double top formation, with sellers likely awaiting a close below 1.2160 to further pick up steam.


