
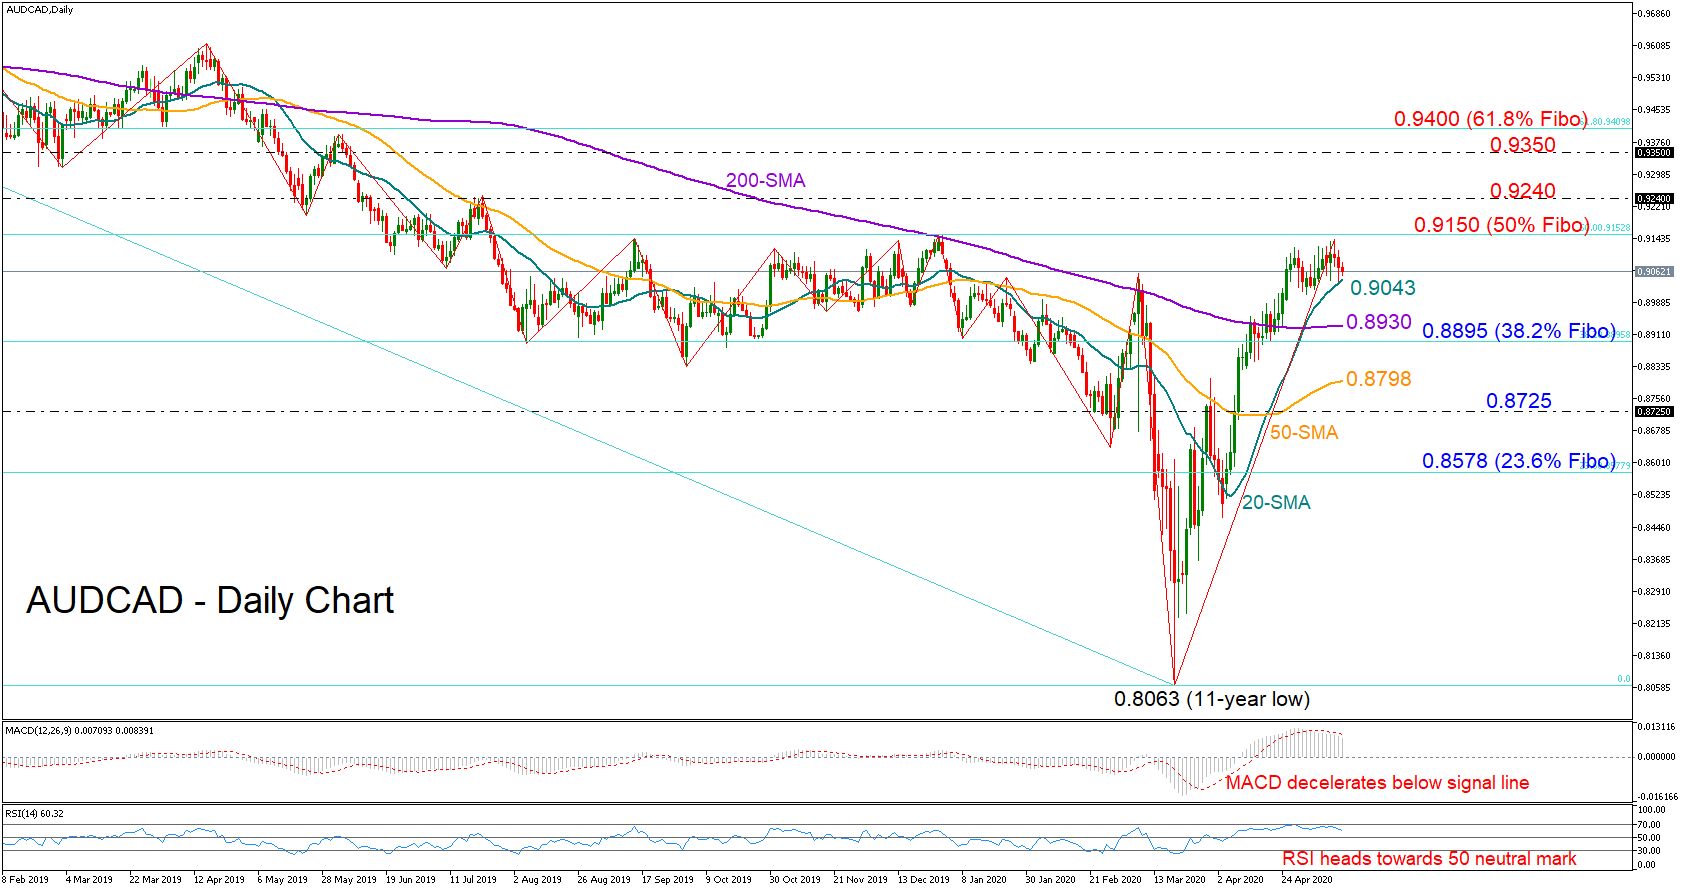
AUDCAD has been showing a clearer bearish tendency since the start of 2018 which could now come into question if the price manages to extend its latest rebound above the swing high of 0.9150. The 50% Fibonacci of the downleg with a peak at 1.0241 and a trough at 0.8063 is also placed around this point, adding extra importance to the area.
On the daily chart the RSI and the MACD are not in favor of additional upside corrections as both indicators are losing momentum. However, the 20-day simple moving average (SMA) at 0.9043 could come to the rescue, saving the price from falling towards the 200-day SMA and the 38.2% Fibonacci of 0.8895. Should sellers push below the 50-day SMA, closing beneath the 0.8725 support region too, the 23.6% Fibonacci of 0.8578 could become more approachable.
In the positive scenario, where the pair rallies above the 0.9150 ceiling, the bulls could initially stall around 0.9240 and then somewhere between 0.9350 and the 61.8% Fibonacci of 0.9400, further increasing hopes of an upward-trending market.
Summarizing, AUDCAD could face downside pressures in the short-term, though the 20-day SMA could hold the focus on the upside if it manages to block the way down. Subsequently, a break above 0.9150 could disturb the long-term downtrend.


