
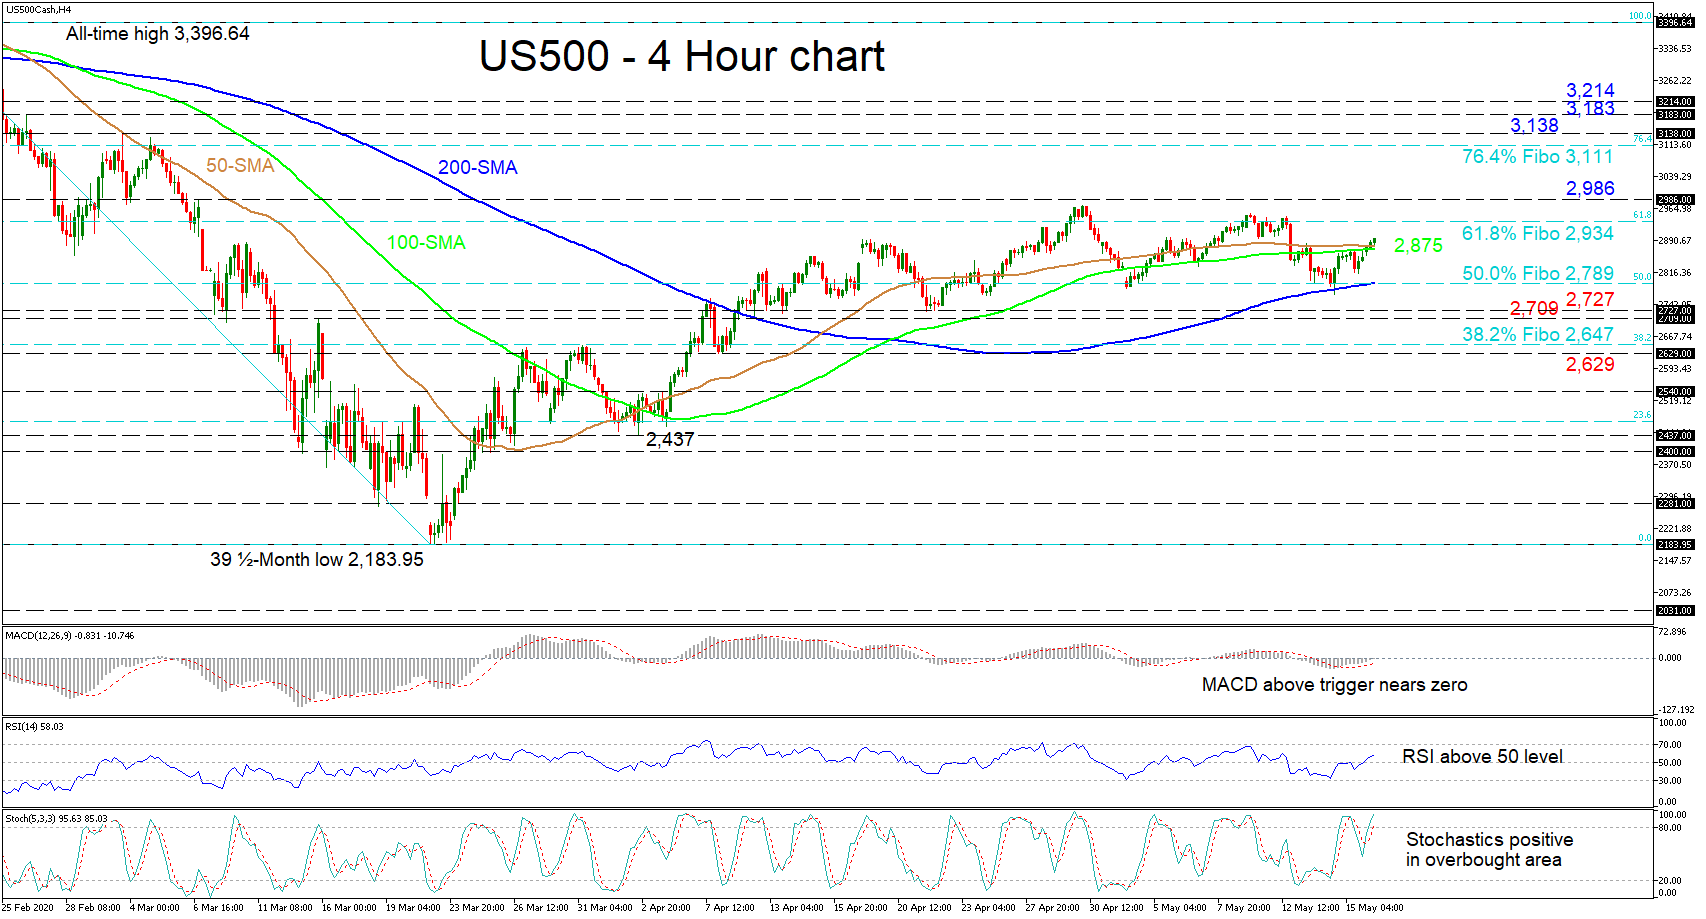
US 500 stock index (Cash) in previous sessions found a foothold at the advancing 200-period simple moving average (SMA) currently at the 2,789 level, that being the 50.0% Fibonacci retracement of the down leg from the all-time-high of 3,396.64 till the 39½-month low of 2,183.95. At present, the price has pierced above the mostly flat 50- and 100-period SMAs and the positive move seems to be backed by the short-term oscillators.
The MACD in the negative zone is above its red signal line and is nearing the zero mark, while the RSI has pushed over its neutral threshold. Moreover, the stochastic lines have entered the overbought section and have yet to show signs of weakening in the recent up-move.
Lasting gains may initially face the 61.8% Fibo of 2,934 ahead of the 2,986 peak from March 6. A jump above may send the index to a resistance section from the 76.4% Fibo of 3,111 until the 3,138 high of March 3. Another step higher, the index could encounter the 3,183 peak and the 3,214 inside swing low of February 24 before the focus turns to a revisit of the all-time high.
Otherwise, if sellers steer back below the MAs, support could originate at the 200-period SMA, residing at the 50.0% Fibo of 2,789. Moving underneath, the lows within the area of 2,727 – 2,709 could challenge the decline ahead of another important support region from the 2,629 trough to the 38.2% Fibo of 2,647, which is keeping the correction from 2,183.95 intact.
Summarizing, the very short-term picture possesses a neutral-to-bullish bearing above the 2,709 barrier and only a shift below 2,629 could bring back a downside tendency.


