
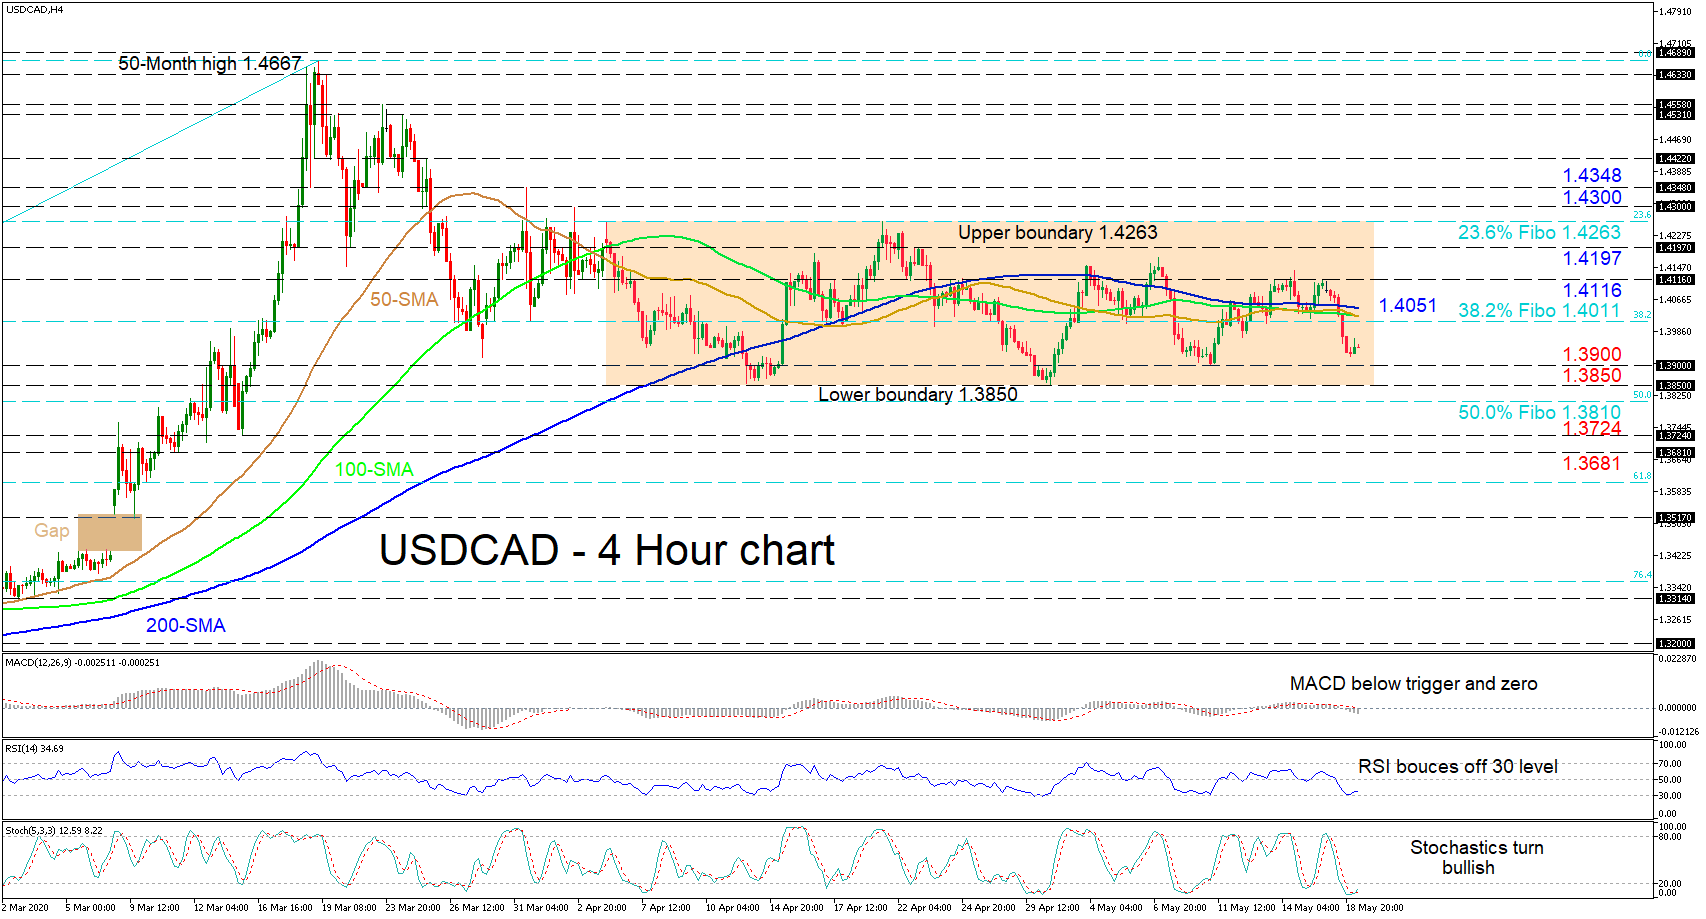
USDCAD lost ground once again within a sideways market – that begun around April 6, – falling under the directionless simple moving averages (SMAs) and the 1.4011 level, that being the 38.2% Fibonacci retracement of the up leg from 1.2951 to the 50-month peak of 1.4667. The decline towards the lower boundary of the range looks to have stalled, slowing ahead of the 1.3900 low, something also reflected in the RSI and the stochastic oscillator.
The RSI is improving after a bounce at the 30 mark and the stochastic oscillator is signalling a bullish bearing, as the blue %K line overlaps the red %D line within the oversold region. However, a conflicting view is displayed in the MACD, which is falling below its red signal line and the zero level, promoting further deterioration in price.
If sellers redirect the pair downwards, initial support could develop from the 1.3900 low and the foundation of the range at 1.3850. Diving under the base, if the 50.0% Fibo of 1.3810 fails to apply the brakes, the pair may then move to test the key trough of 1.3724 from March 16 and the 1.3681 barrier of March 11.
Alternatively, buyers may face initial strong resistance from the 38.2% Fibo of 1.4011 until the 200-period SMA at 1.4051, followed by highs from 1.4116 to 1.4197 (involving 1.4140 and 1.4173). If buyers’ efforts prevail and overcome the ceiling of the consolidation pattern, that being the 23.6% Fibo of 1.4263, the attention may then shift towards the 1.4300 and 1.4348 peaks.
Overall, the very short-term picture sustains a neutral-to-bullish tone above the 1.3850 point and traders may be looking for a break of the confines of 1.3850 or 1.4263 to reveal the next direction.


