
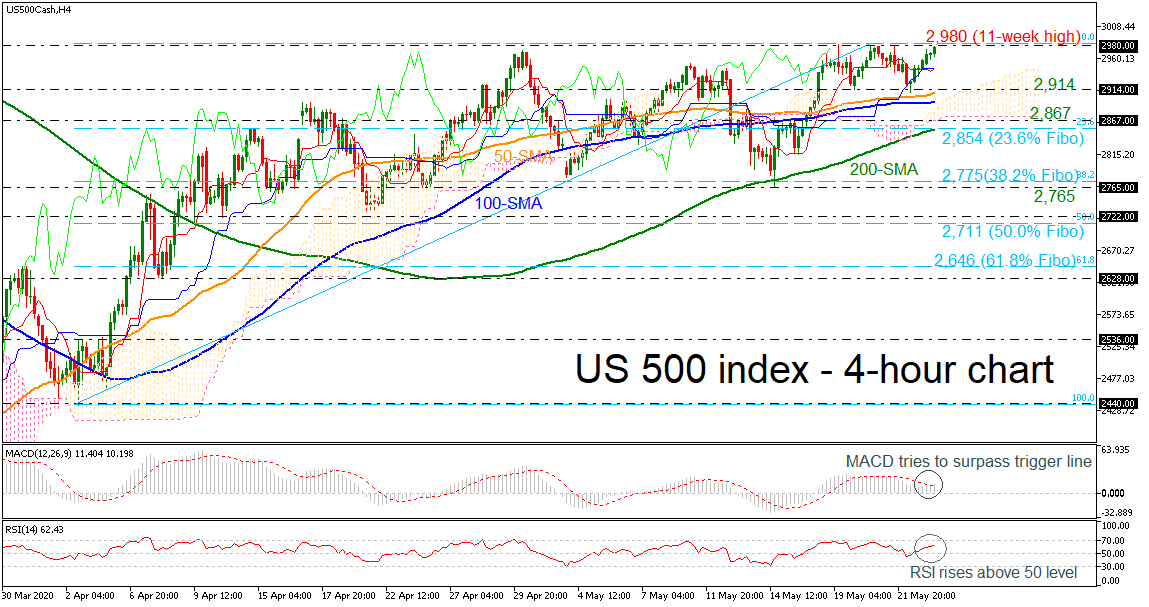
The US 500 index (Cash) has finally reversed to the upside last Friday after flirting with the 50-period simple moving average (SMA) around 2,906. The upward pattern started at the end of March, but the market needs to beat the immediate resistance at 2,980 for more significant increases. Above that the market could meet the 3,140 – 3,205 resistance, taken from the high on March 3 and the inside swing low from January 31.
The momentum indicators in the four-hour chart though are currently supporting that positive move and it is likely to strengthen in the short-term. Specifically, the MACD is picking up speed above its trigger line and the RSI continues to distance itself above is neutral threshold of 50.
Should the price decisively close below the ground of the 2,914 level, bears could extend the downward move towards the 50- and 100-period SMAs at 2,908 and 2,893 respectively. Further declines could hit the lower surface of the Ichimoku cloud, which stands near the 2,867 support level. Such a move could also post a clear step below the Ichikomu cloud, hitting the 23.6% Fibonacci retracement level of the upward wave from 2,440 to 2,980 at 2,864, which overlaps with the 200-period SMA.
In brief, if the market extends its move above the eleven-week high of 2,980 could endorse the bullish outlook in the short-term, returning back to strong positive actions.


