
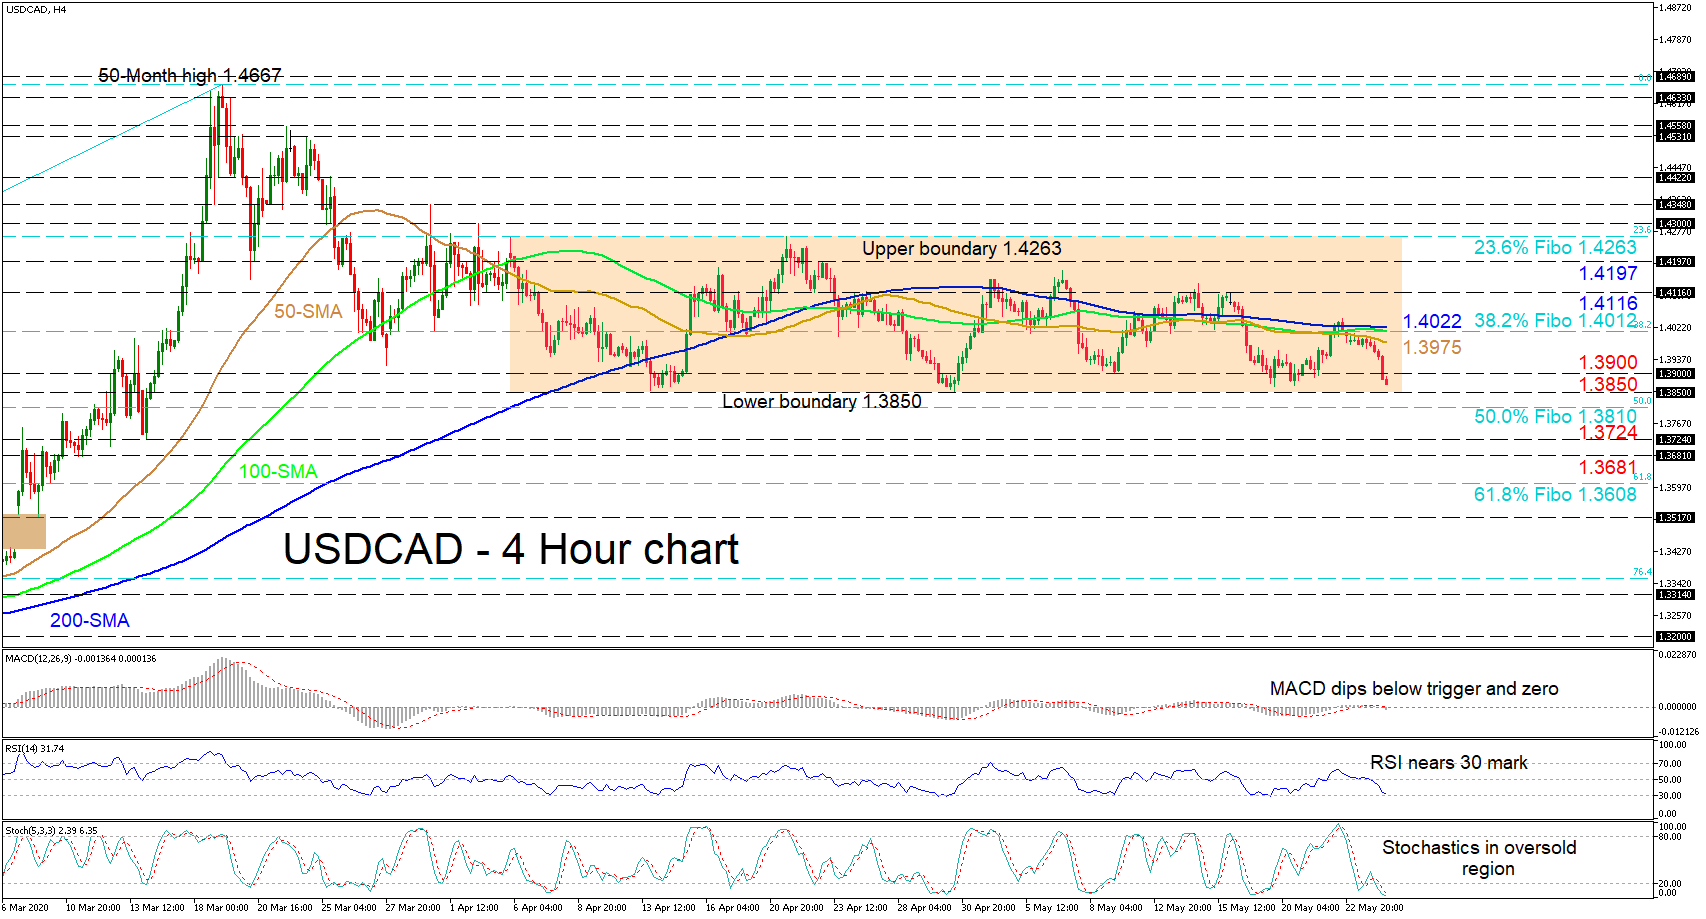
USDCAD failed again to beat the mostly flattened simple moving averages (SMAs) and is currently headed to retest the lower boundary of the horizontal market at 1.3850.
The short-term oscillators further reflect the latest down turn in price with the RSI having approached the 30 mark from the bullish section, and the stochastic lines declining from previous overbought regions into oversold territory. Moreover, the MACD under weak directional momentum has only just dipped below its red signal line and the zero point. Noteworthy, is the fact that the RSI and stochastics are oversold as price is located at the base of the range, therefore an upside reversal can’t be ruled out.
In the event that sellers breach the foundation of the sideways market at 1.3850, the 1.3810 obstacle below, may provide significant support, that being the 50.0% Fibonacci retracement of the up leg from the 1.2951 low to the 50-month high of 1.4667. Steering lower, should the significant troughs of 1.3724 and 1.3681 fail to impede the decline, the 61.8% Fibo of 1.3608 may come under focus.
If buyers redirect the pair above the 1.3900 level, resistance could develop from 1.3975 until 1.4022, which is an area where the flat SMAs and the 38.2% Fibo of 1.4012 currently reside. Overcoming these barriers, a section of highs within the range from 1.4116 – 1.4197 (involving 1.4140 and 1.4173) could test the advancement towards the roof of the consolidation pattern (23.6% Fibo of 1.4263).
Overall, the very short-term timeframe remains neutral-to-bullish above the 1.3850 foundation. Yet, it seems that only a decisive break above 1.4263 or below 1.3850 can set the forthcoming course.


