
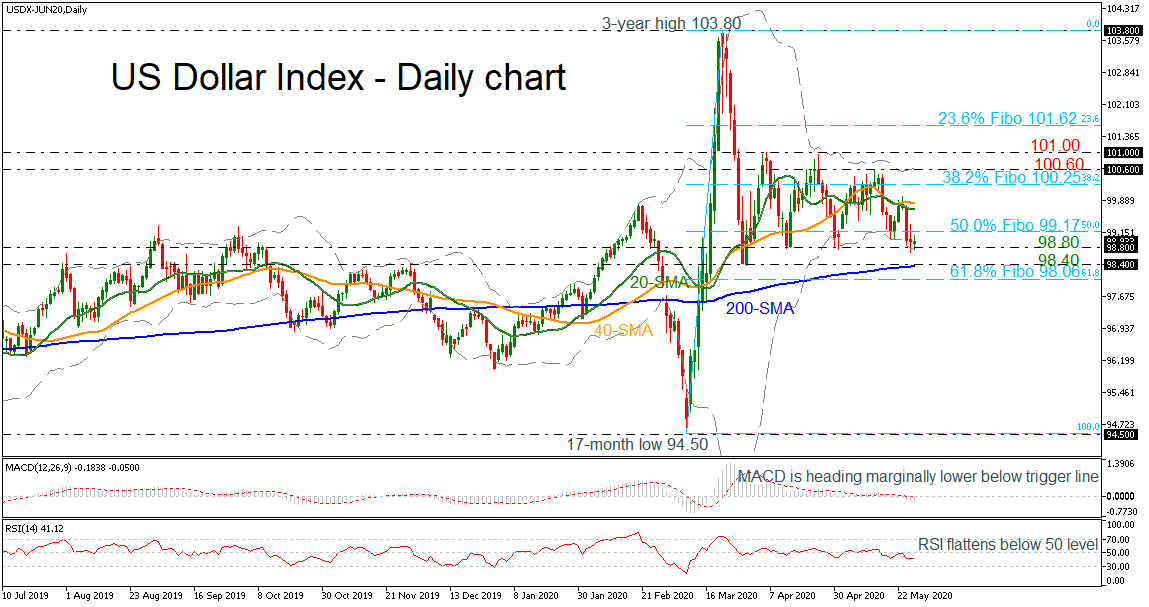
The US dollar index looks to be mostly neutral after a descent from the March 20 peak of the three-year high of 103.80, returning the price back below the 101.00 barrier and below the 20- and 40-day simple moving averages (SMAs).
The decline in the MACD oscillator and the flattening mode in the RSI in the negative region are suggesting more losses in the near term, pushing the market towards the 98.40 support level, which overlaps with the 200-day SMA. Clearing this significant zone, the 61.8% Fibonacci retracement level of the upward wave from 94.50 to 103.80 at 98.06 could come into the spotlight, before slipping sharply lower to the 17-month trough of 94.50.
Alternatively, if the price jumps above the 50.0% Fibonacci of 99.17, it could then touch the 20- and 40-day SMAs currently at 99.70 and 99.84 respectively. Higher still, the 38.2% Fibo is acting as an obstacle ahead of the upper Bollinger band at 100.60 and the 101.00 round number.
Summarizing, the US dollar index has been consolidating since March 27 and only a close beneath the 200-day SMA could confirm the negative sentiment in the technical indicators. On the other hand, a climb above the Bollinger band and the 23.6% Fibo may shift the bias to somewhat positive.


