
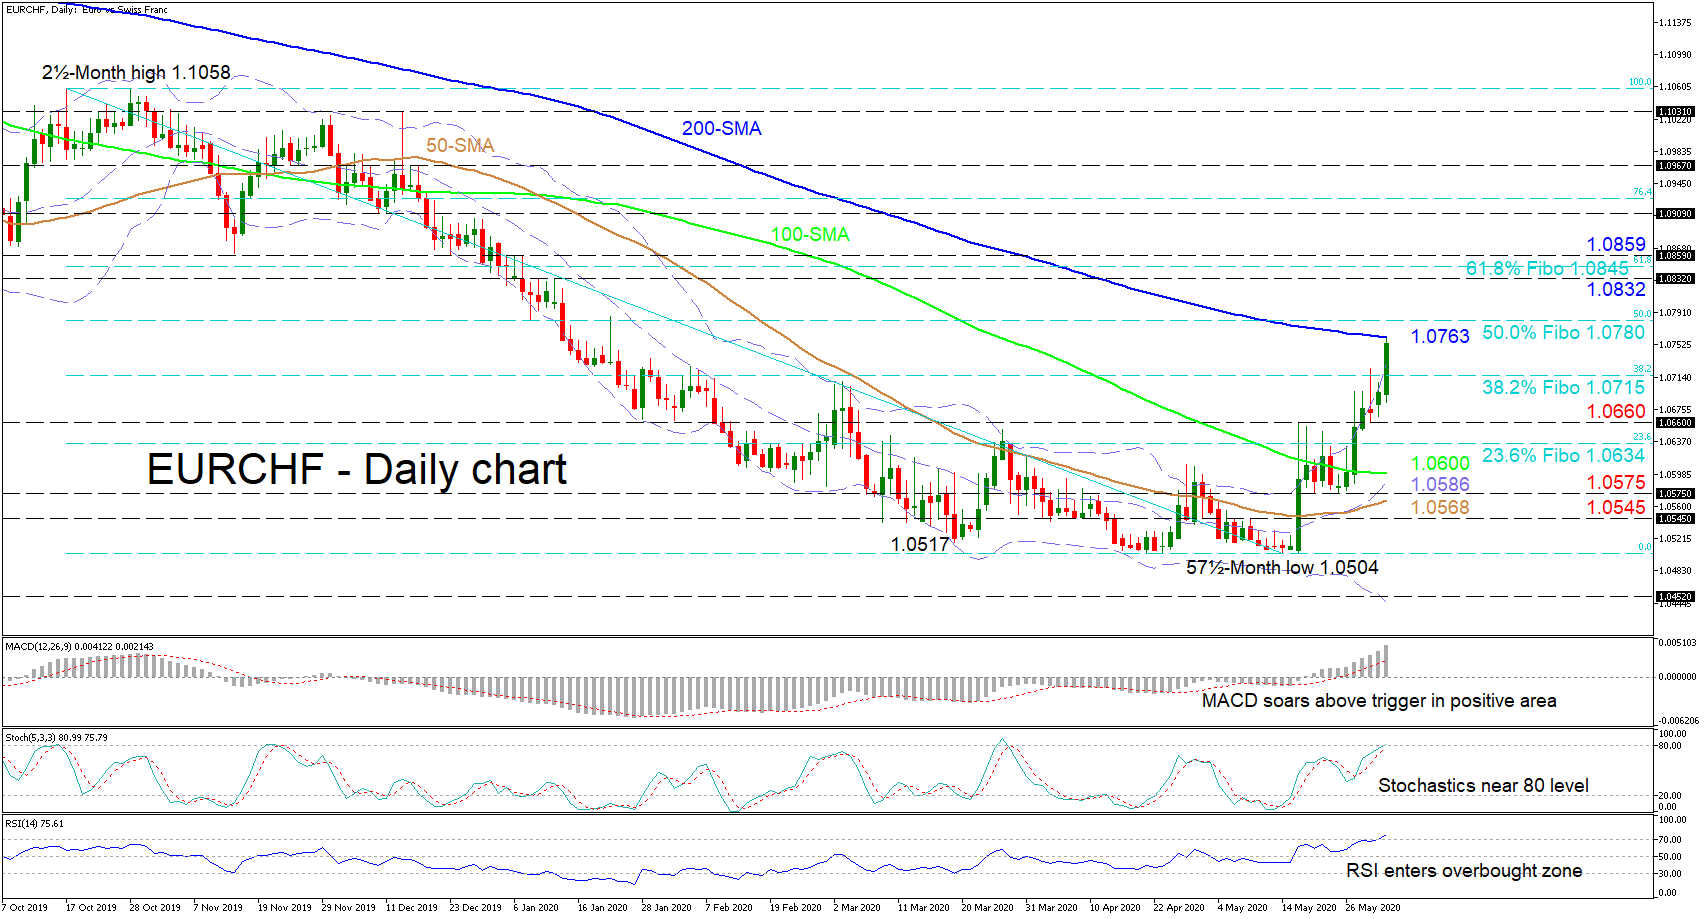
EURCHF’s latest gains off of the 1.0575 mark have followed the upper Bollinger band until the 200-day simple moving average (SMA). Additionally, the momentum indicators reflect buyers’ efforts for further advances, despite the capping 200-day SMA at 1.0763.
The short-term oscillators at the moment continue to reflect an improving picture with no signs of easing. The MACD, in the positive region, is increasing above its red signal line, while the rising RSI climbs into the overbought section. Moreover, the stochastic lines maintain a positive tone near the 80 level. Noteworthy, is the weakening in the negative bearing of the 50- and 100-day simple moving averages (SMAs), which further endorse this view.
Should the price overcome the 200-day SMA at 1.0763, immediate resistance could surface from the nearby 1.0780 obstacle, that being the 50.0% Fibonacci retracement of the down leg from 1.1058 to 1.0504. Ascending further, a more sustained push will be required to overrun a key resistance trench from 1.0832 to 1.0859, which includes the 61.8% Fibo of 1.0845, ultimately turning the picture neutral-to-bullish in the medium-term timeframe.
In case the 200-day SMA rejects upside corrections, initial limitations could develop at the 38.2% Fibo of 1.0715 ahead of the 1.0660 low. Extra weakening in the price could meet the 23.6% Fibo of 1.0634 prior to a key support section from the 100-day SMA at 1.0600 until the 50-day SMA of 1.0568. Conquering these obstacles, which include the 1.0586 lower Bollinger band and the low of 1.0575 may open the door for the 1.0545 barrier and spark worries for a resuming negative trend.
Summarizing, despite the latest positive run, a shift above the 1.1058 high is required to develop a bullish bias in the short- and medium-term timeframes.


