
Key Highlights
- GBP/USD soared above 1.2500 and traded to a new monthly high at 1.2731.
- A major bullish trend line is forming with support near 1.2600 on the 4-hours chart.
- EUR/USD is holding the 1.1250 and 1.1220 supports levels.
- The Euro Zone Gross Domestic Product is likely to decline 3.8% in Q1 2020 (QoQ).
GBP/USD Technical Analysis
This past week, the British gained momentum above the 1.2500 resistance against the US Dollar. GBP/USD accelerated higher above 1.2600 and traded to a new monthly high.
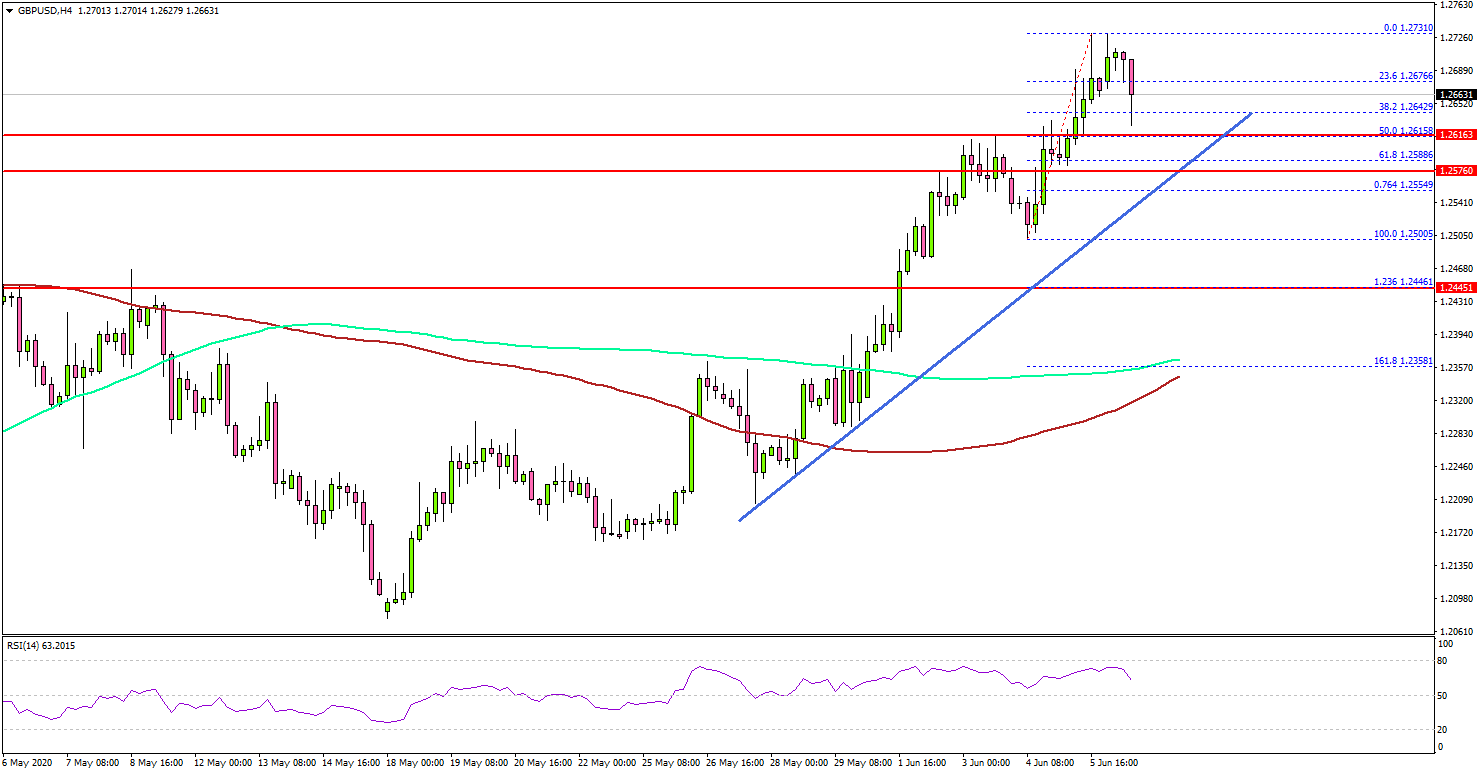
Looking at the 4-hours chart, the pair traded as high as 1.2731 and settled well above both the 100 simple moving average (red, 4-hours) and the 200 simple moving average (green, 4-hours).
Recently, there was a minor downside correction below 1.2700. There was a break below the 23.6% Fib retracement level of the upward move from the 1.2500 low to 1.2731 high.
On the downside, there is a decent support forming near the 1.2600 area. There is also a major bullish trend line forming with support near 1.2600 on the same chart. The trend line is close to the 50% Fib retracement level of the upward move from the 1.2500 low to 1.2731 high.
Therefore, dips are likely to find a strong buying interest near 1.2600. Any further losses may perhaps push GBP/USD towards the 1.2550 support.
On the upside, there is a key barrier forming near the 1.2700-1.2720 zone. A successful close above 1.2720 could open the doors for a large upward move.
Similarly, EUR/USD is trading in an uptrend above the key 1.1250 and 1.1220 support levels.
Upcoming Economic Releases
- Euro Zone Gross Domestic Product Q1 2020 (QoQ) – Forecast -3.8%, versus -3.8% previous.
- Euro Zone Gross Domestic Product Q1 2020 (YoY) – Forecast -3.2%, versus -3.2% previous.


