
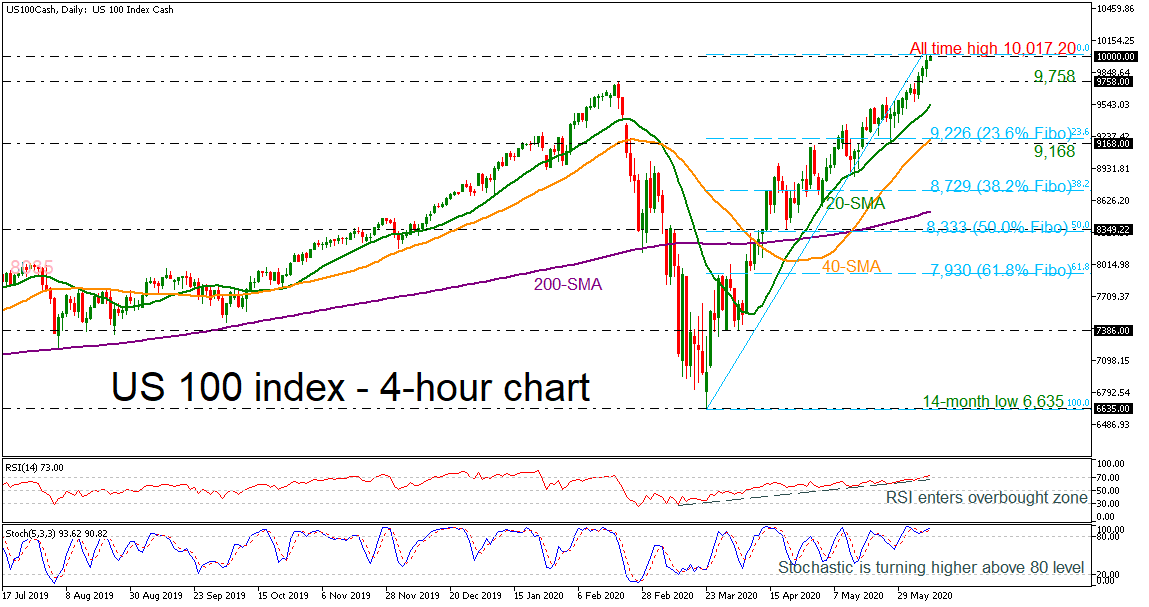
The US 100 cash index skyrocketed to a fresh all-time high of 10,017.20 earlier today, stretching its bullish outlook from the 14-month trough of 6,635 posted on March 23. According to the momentum indicators the strong bullish tendency could continue as both the RSI and stochastics are continuing to flirt with overbought levels. The RSI has just jumped above the 70 level, remaining above the rising line, while the stochastic is pointing up, posting a bullish crossover within its %K and %D lines above 80.
If there is a successful attempt above the all-time high of 10,017.20, the index could meet the next psychological numbers such as 10,500 and 11,000 before hitting the 161.8% Fibonacci extension of the down leg from 7,758 to 6,635 at 11,657.
In case of a bearish correction mode, the price could find immediate support at the 9,758 level ahead of the 20-day simple moving average (SMA) at 9,552. Below that, the 40-day SMA, which overlaps with the 23.6% Fibonacci retracement level of the upward wave from 6,635 to 10,017.20 at 9,226 and stands near the 9,168 barrier, could be in focus. Clearing this zone too, the 38.2% Fibonacci at 8,729 is coming next to halt bearish movements.
In brief, the US 100 index turned the long-term outlook to bullish as well and only declines beneath the 200-day SMA could switch this view to neutral.


