
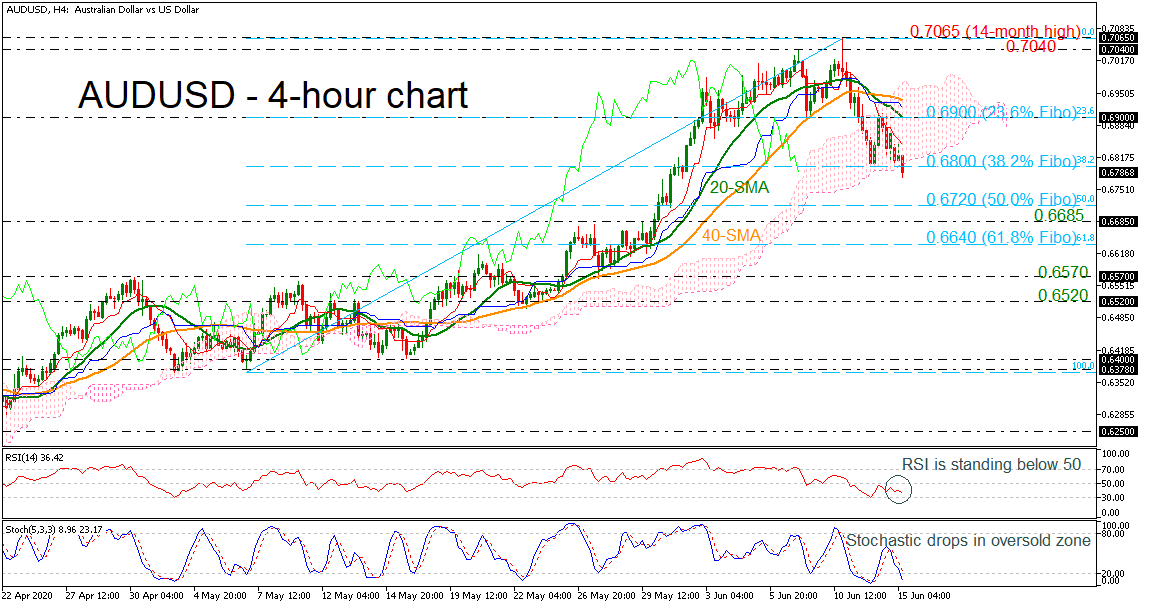
AUDUSD is slipping to a new two-week low around 0.6775, penetrating the 38.2% Fibonacci retracement level of the up leg from 0.6375 to 0.7065 at 0.6800 and the lower surface of the Ichimoku cloud.
According to the momentum indicators, the RSI is moving sideways in the negative zone, while the stochastic dropped in the oversold zone, confirming the recent negative structure. Additionally, the 20- and 40-period simple moving averages (SMAs) completed a bearish crossover in the 4-hour chart.
A stronger downside movement could send prices towards the 50.0% Fibonacci of 0.6720 and the 0.6685 support barrier. If traders continue to sell the pair, immediate support could be faced near the 61.8% Fibonacci at 0.6640.
In case of a rebound at the 0.6800 handle, buyers could see the 0.6900 psychological number, which is the 23.6% Fibonacci and overlaps with the 20-period SMA. Above that, the 40-period SMA at 0.6935 and the upper surface of the cloud at 0.6990 could come into focus ahead of the 0.7040 – 0.7065 resistance zone.
Concluding, the pullback on the 14-month peak of 0.7065 on June 10 shifted the very short-term bias to negative; however, in the bigger picture, the pair remains bullish.


