
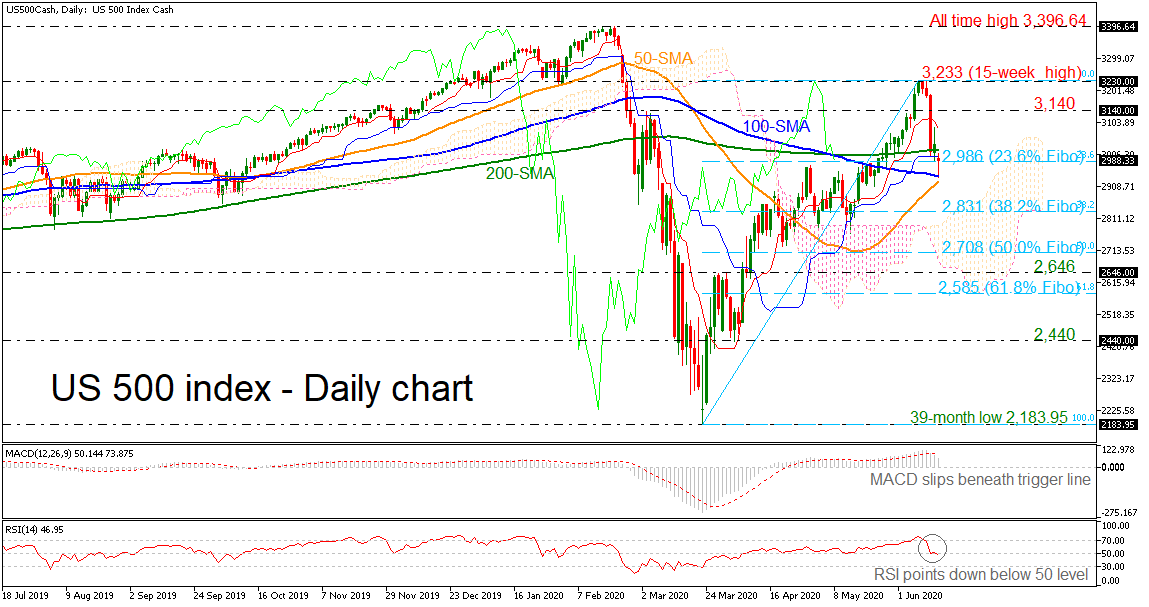
The US 500 cash index remains under pressure as its price continues to drift lower from the 15-week high of 3,233. The short-term technical indicators in the daily chart are bearish and point to more weakness in the market.
The flat 200-period simple moving average (SMA is currently capping positive movements as the 50-day SMA is ready to create a bullish cross with the 100-period SMA, which is acting as a critical support level. The MACD is slipping beneath its trigger line, while the RSI is sloping down in the negative region.
The next target to the downside is the 2,831 level, which is the 38.2% Fibonacci retracement of the 2,183.95 – 3,233 up leg, if the price breaks the SMAs. Falling inside the cloud, the market could stall near the 50.0% Fibonacci of 2,708. Below that, the 2,646 support could come in the radar.
Upside moves are likely to find resistance at the 200-period SMA at 3,018 before challenging the downward-sloping red Tenkan-sen line at 3,085. Rising above this area, the focus would initially shift towards 3,140 and then to 3,233.
In the medium-term, the bullish phase remains in play and could further strengthen if the price manages to hold above a possible bullish cross within the SMAs.


