
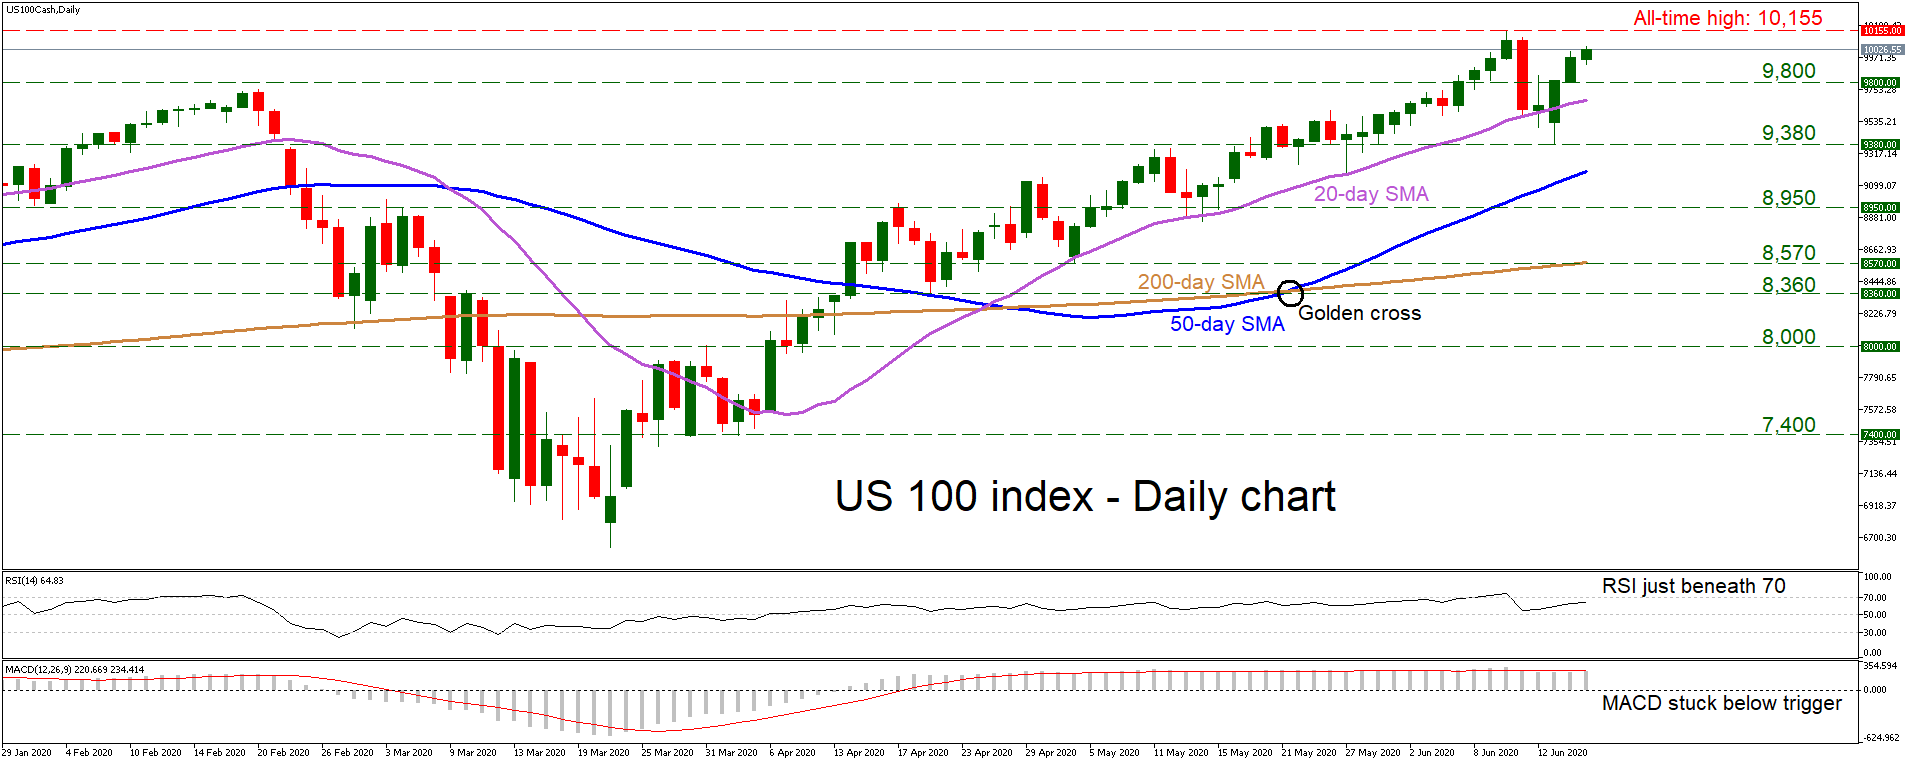
The US 100 cash index (Nasdaq) suffered a small setback last week, after reaching a fresh record high of 10,155, but has since recovered most of its losses. The structure of higher highs and higher lows on the daily chart remains intact, which alongside the upward-sloping simple moving averages (SMAs), keeps the outlook positive. A new all-time high above 10,155 would reaffirm the uptrend.
Short-term momentum oscillators concur. The RSI – already above 50 – looks to be headed for its 70 line. The MACD, although below its red trigger line, is well in positive territory and a move above its trigger would be a positive signal.
If buyers overcome the record peak of 10,155, the market would be back in uncharted waters and the focus would turn to round psychological figures. In this case, resistance may come from 10,500, ahead of the 11,000 handle. Even higher, the bulls may struggle near 11,630, which is the 161.8% Fibonacci extension of the February-March downfall.
Should the bears retake control, initial support may come from the 9,800 level, which is more visible on the four-hour chart. A move below could bring the 20-day SMA currently at 9,680 into play, which has been a tough barrier for sellers. If violated too, all eyes would turn to 9,380 as a break of that zone may call the broader positive outlook into question.
In short, the picture is overwhelmingly bullish. For that to come into doubt, the bears would need a close below 9,380


 Favors Upside")
