
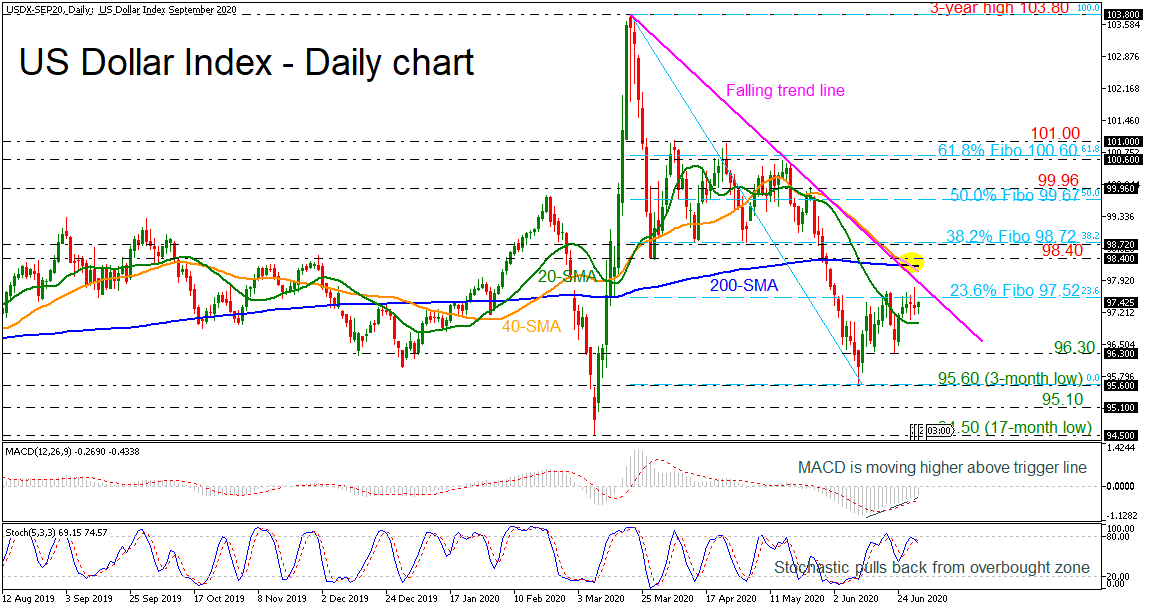
The US dollar index rebounded on the three-month trough of 95.60, finding resistance at the 23.6% Fibonacci retracement level of the down leg from 103.80 to 95.60 at 97.52. The technical indicators seem to be contradicting each other as the MACD holds above the trigger line and is looking bullish, however, the stochastic oscillator is turning lower, suggesting a possible pullback in the short-term.
If buying interest picks up, early tough resistance could occur at the bearish cross of the 40-day simple moving average (SMA) with the 200-day SMA currently at 98.24, where the 98.40 resistance also resides. A violation of this level may propel the index to challenge the 38.2% Fibo of 98.72 and the 50.0% Fibo 99.67, shifting the outlook from bearish to bullish.
Otherwise, if sellers sink deeper and penetrate the 20-day SMA, the 96.30 could provide the key constrictions necessary to sustain the fall. Steeper declines under the line would send the index towards the three-month low of 95.60. Extending lower could encounter the 95.10 support and the 17-month low of 94.50.
Concluding, the US dollar index has been in a descending move since March 20 and only a decisive close above the 38.2% Fibo could change this structure.


