
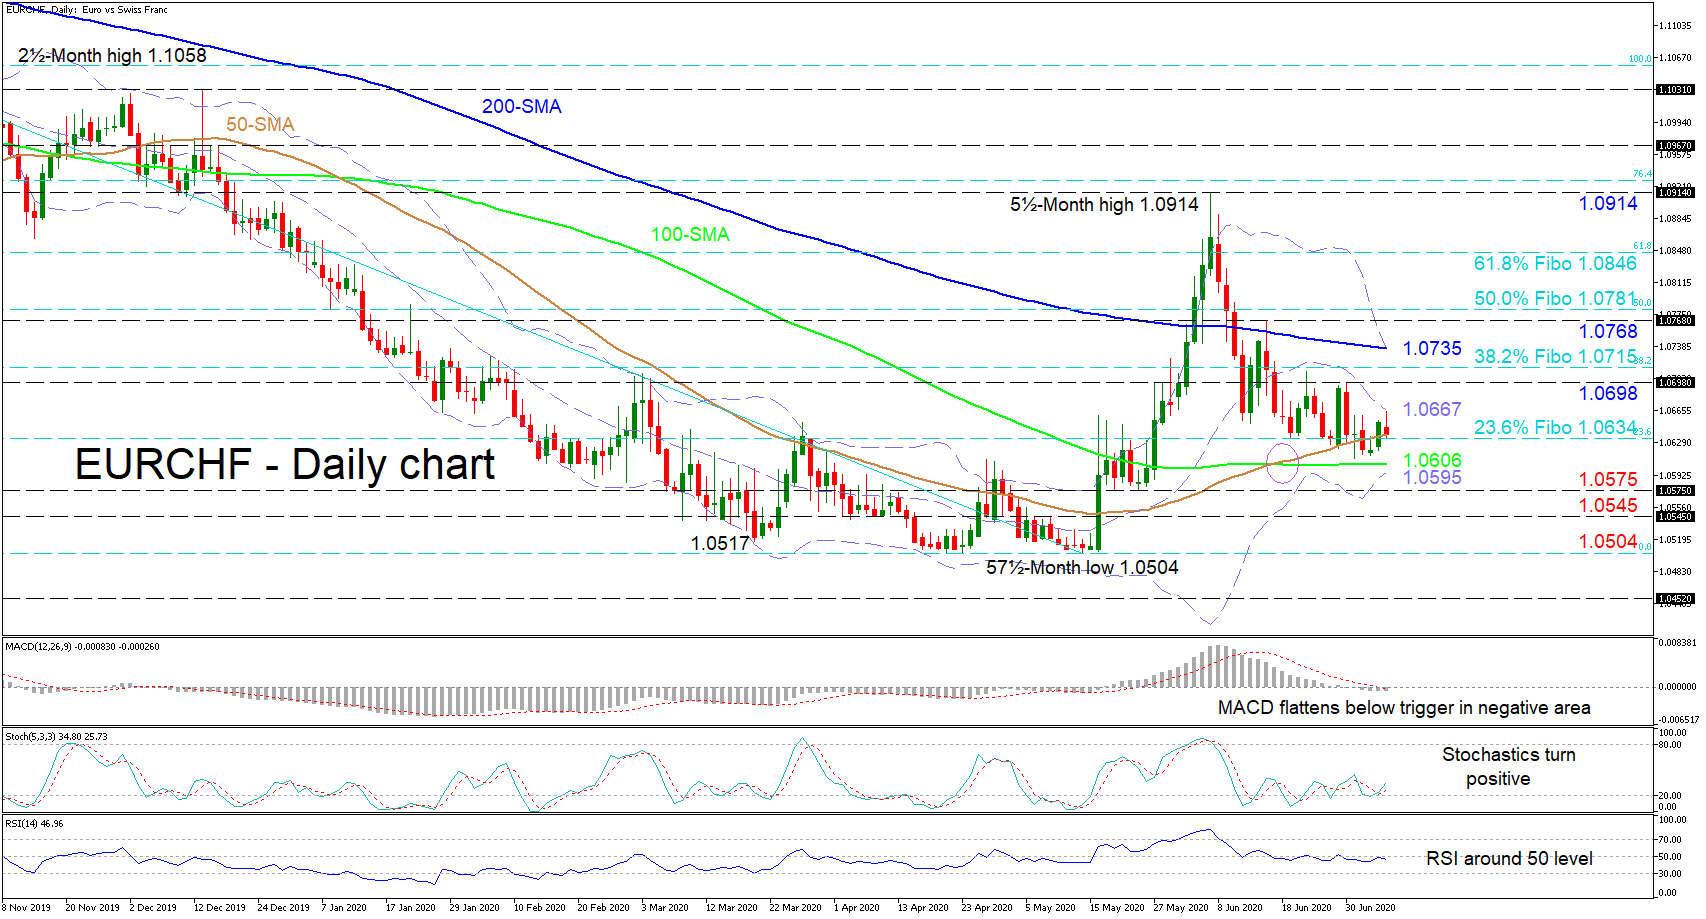
EURCHF appears to be crawling sideways in the latest sessions, after the plunge from the 1.0914 high reversed ahead of the horizontal 100-day simple moving average (SMA), currently at 1.0606.
The MACD and the RSI are not signalling any strong directional signals as they both hover slightly below their neutral marks. Additionally, the mostly flattened 100-and 200-day SMAs further indicate the weakness in price setting a stronger course for now. However, the rising 50-day SMA promotes some strength in the pair as does the stochastic oscillator, whose %K line has positively overlapped the red %D line, bouncing off the 20 level.
In the event buyers manage to push above the mid-Bollinger band at 1.0667, resistance may originate from the 1.0698 nearby high and the 1.0715 level, that being the 38.2% Fibonacci retracement of the down leg from 1.1058 to 1.0504. Should buyers persist and the 200-day SMA at the upper Bollinger band of 1.0735, fail to limit further advances, the price may challenge the 1.0768 barrier and the 50.0% Fibo of 1.0781 overhead. Another push higher may then meet the 61.8% Fibo at 1.0846.
Otherwise, if the price sinks underneath the 50-day SMA at the 23.6% Fibo of 1.0634, the 100-day SMA at 1.0606 may attempt again to apply the brakes on the decline. If further weakening in price unfolds, diving even beneath the important lower Bollinger band at 1.0595, the key trough of 1.0575 may provide significant support. Moving lower, the 1.0545 hurdle could draw focus ahead of the 57½-month low of 1.0504.
In brief, a neutral bias has returned to the short-term timeframe. Yet, to build confidence, the pair would need to break above the 1.0914 peak, while a drop below 1.0575 could trigger negative worries.


