
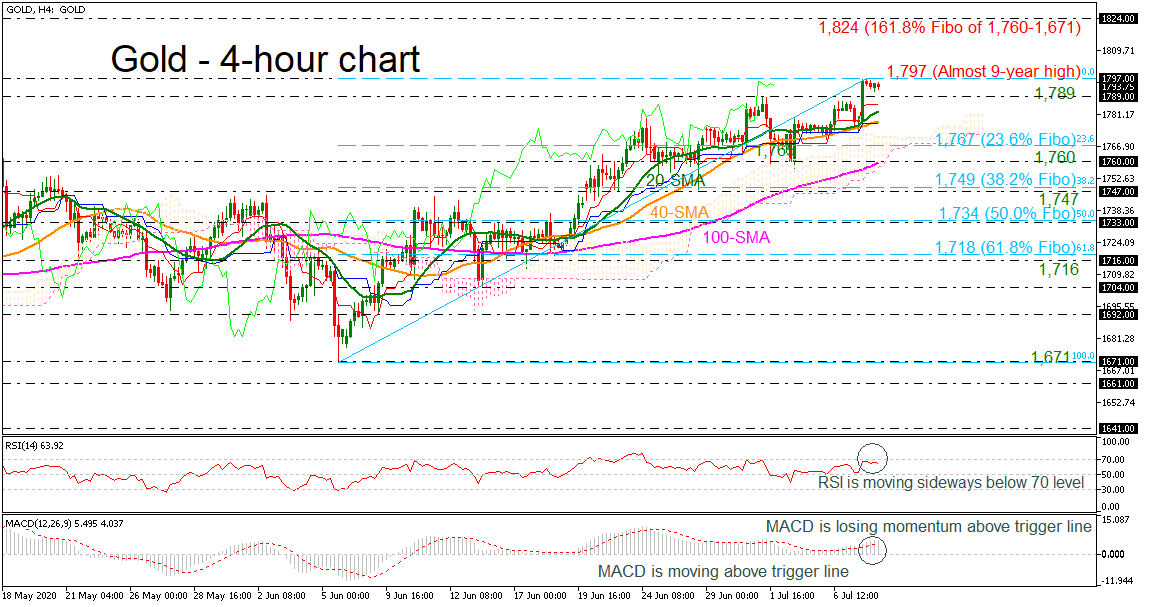
Gold surged to an almost nine-year peak of 1,797 on Tuesday’s session, retaining the strong bullish structure. Currently, the price is holding well above the simple moving averages (SMAs) and the Ichimoku cloud in the 4-hour chart. However, looking at the short-term technical indicators, the RSI is moving sideways slightly below the 70 level, while the MACD, still above its trigger line, is losing momentum, suggesting a possible downside retracement.
If the yellow metal has a successful attempt above the nine-year top of 1,797, it could reach the 161.8% Fibonacci extension level of the down leg from 1,760 to 1,671 at 1,824. Higher still, the market could re-challenge the 1,920 resistance, taken from the peak on September 2011.
On the other hand, a decline could find immediate support at 1,789 before meeting the 20- and 40-period SMAs at 1,782 and 1,777 respectively. Furthermore, the upper surface of the Ichimoku cloud at 1,770 and the 23.6% Fibonacci from 1,671-1,797 at 1,767 could be crucial levels for the bears. Beneath that, the 1,760 support, which coincides with the 100-period SMA, could attract investors’ eyes. Breaching these levels, the price may pause its downside correction near the 38.2% Fibonacci of 1,749.
Summarizing, the commodity has exhibited in an upside tendency over the last four months and only a drop beneath the 61.8% Fibo of 1,718 may change this outlook.


")


