
The GBP/CHF exchange rate has been trading within a falling wedge pattern since the middle of May.
From a theoretical point of view, it is likely that the currency pair could continue to decline within the given pattern until the beginning of August. Then, a breakout north could occur.
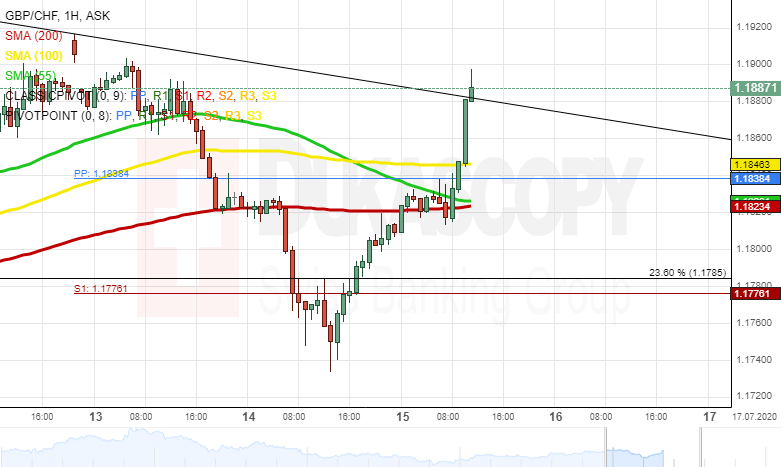
Meanwhile, note that the exchange rate could gain support from the 55-, 100– and 200-hour SMAs in the 1.1840. Thus, a breakout north could occur sooner, and the rate could target the Fibo 38.20% at 1.2181.


